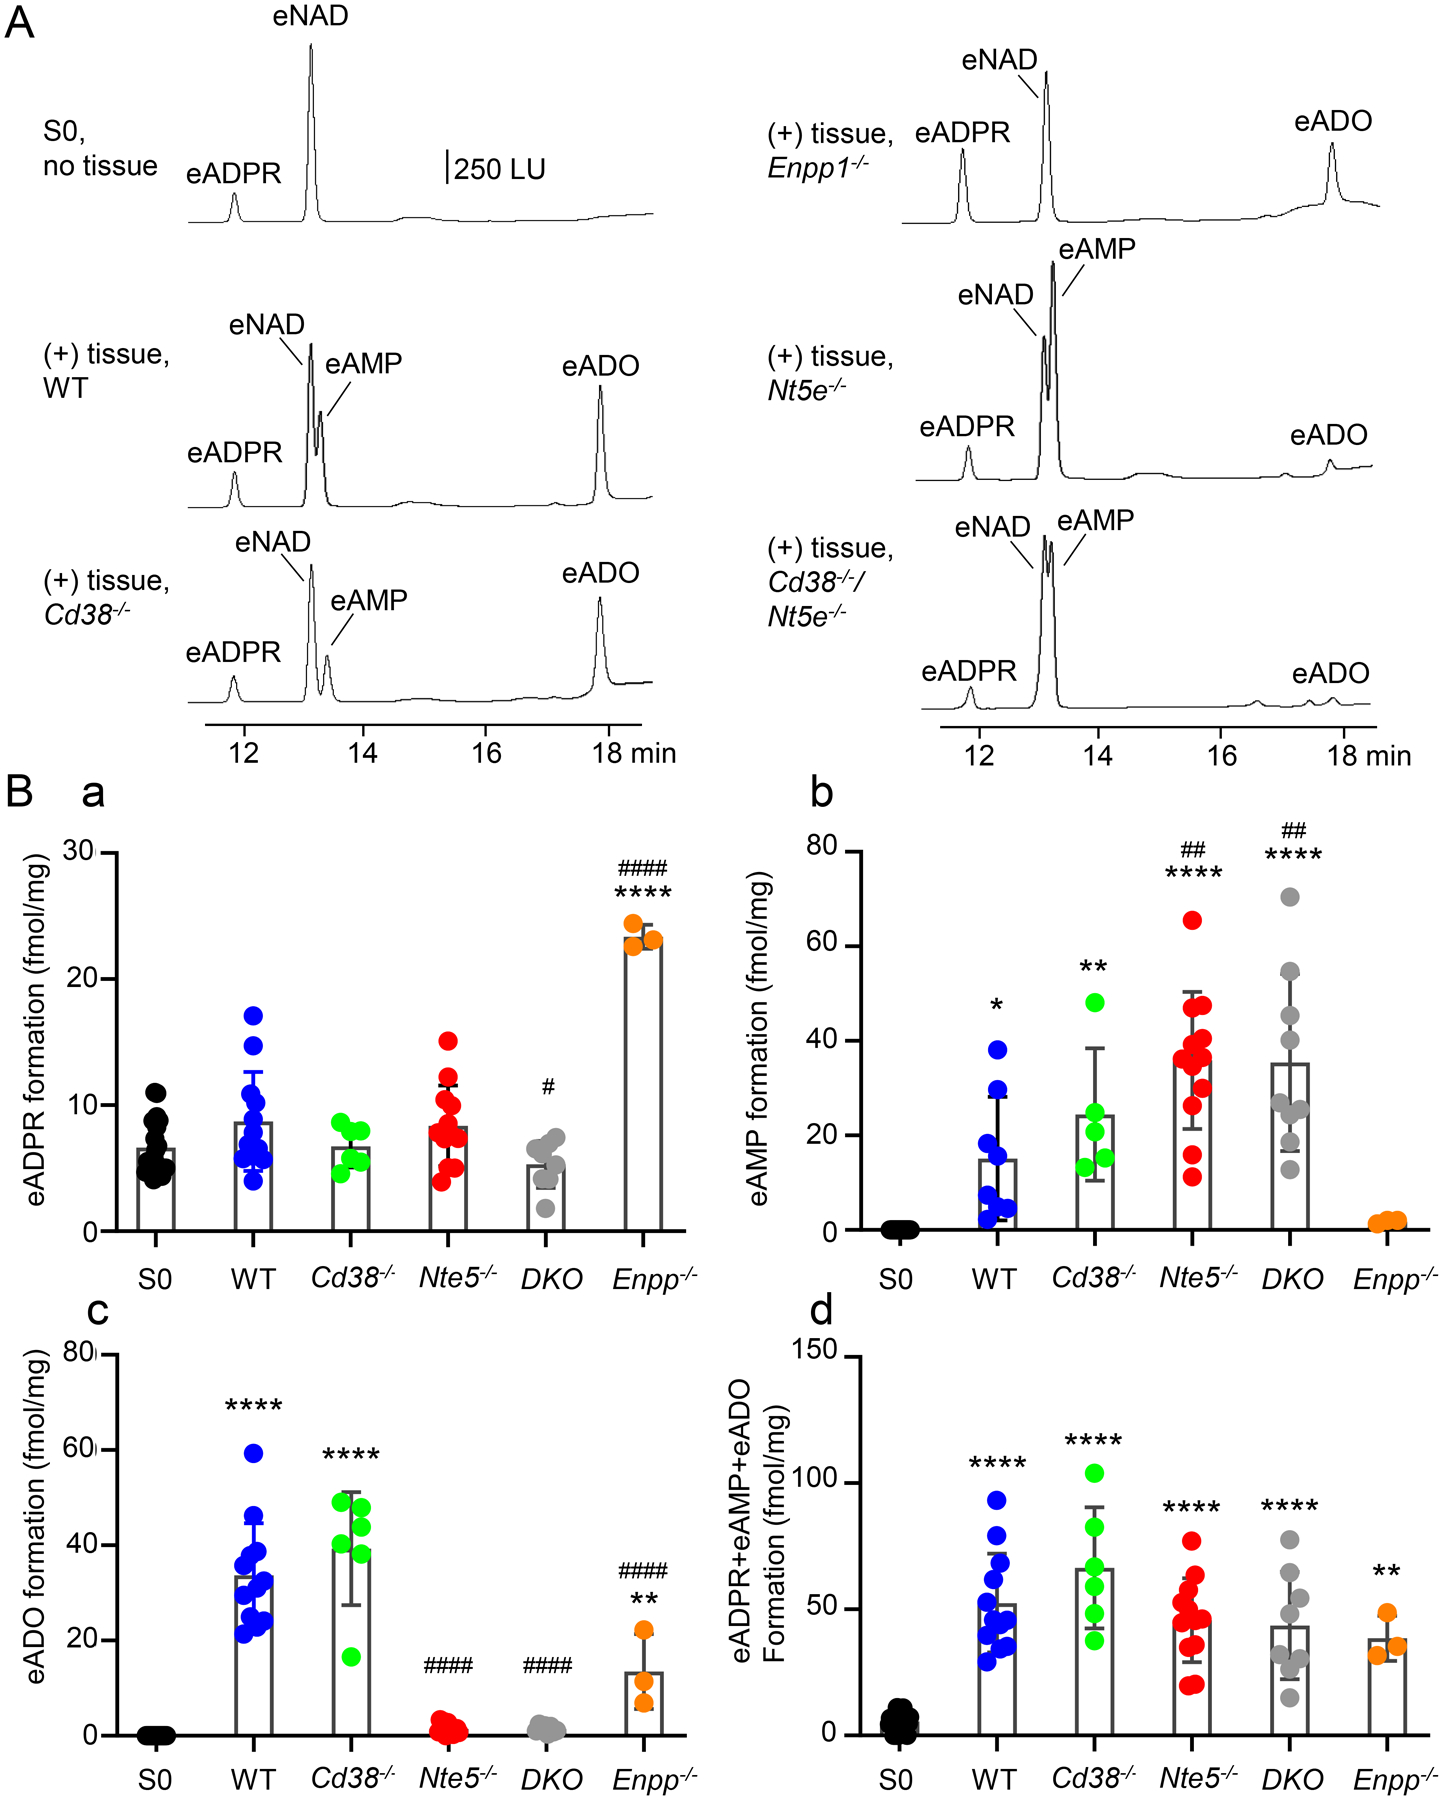
Figure 2.

A. Original chromatograms representing the degradation of eNAD in tunica muscularis preparations of colons of wild-type (WT) and knockout mice. LU, luminescence units. B. Scattered plots (means, SD) of eNAD metabolites produced after contact of eNAD substrate with colonic muscularis. Each data point (closed circles) represents a result from one experiment. Each experiment is performed in one perfusion chamber containing tissue preparations from two mice. Asterisks demonstrate significant differences from S0 (no tissue) (* P < 0.05; **P < 0.01; ***P < 0.001; ****P < 0.0001). Number signs demonstrate statistically significant differences from WT controls (# P < 0.05; ###P < 0.001; ####P < 0.0001). Data analyzed with One-way ANOVA with Dunnett’s multiple comparison test (GraphPad Prism, v. 8.3.0, GraphPad Software, Inc, San Diego, CA). DKO, double knockout mice = Cd38−/−/Nt5e−/− mice.
