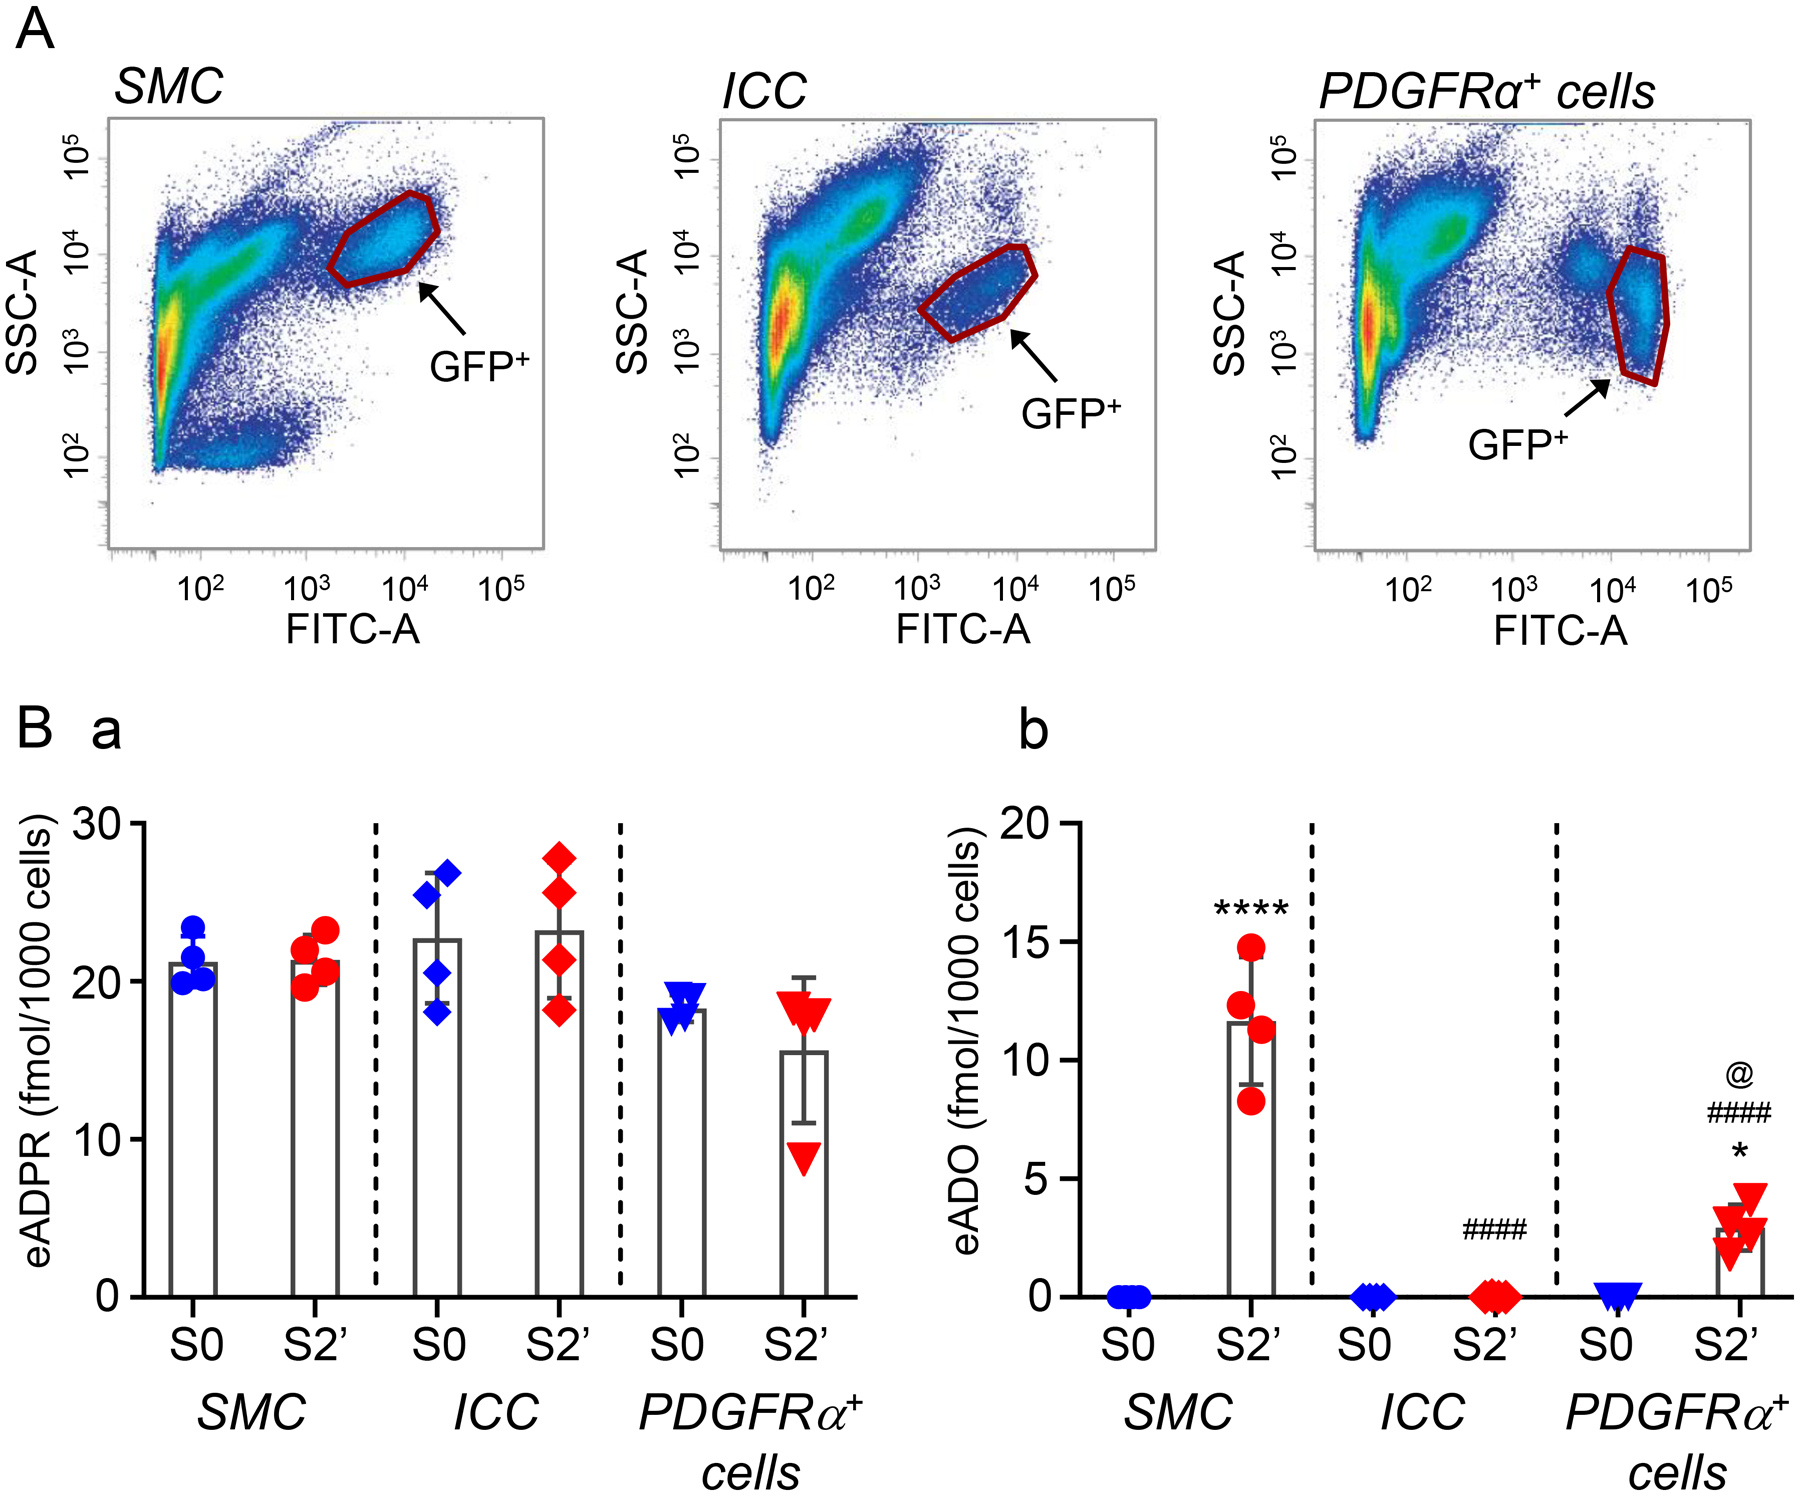
Figure 5.

A. SMCs, ICC and PDGFRα+ cells of colonic tunica muscularis purified by fluorescence-activated cells sorting. B. Scattered plots (mean, SD) demonstrating product formation after exposure of cells to eNAD substrate for 2 minutes. Each data point represents a result from a single experiment performed with 35,000–62,000 cells collected from 4–5 mouse colons. Asterisks denote significant differences from S0 (no tissue) (* P < 0.05; ****P < 0.0001). Number signs denote significant differences from S2’ of SMC (####P < 0.0001). The at symbol denotes significant difference from S2’ of ICC (@ < 0.05). One-way ANOVA with Dunnett’s multiple comparison test (GraphPad Prism v. 8.3.0, GraphPad Software, Inc, San Diego, CA).
