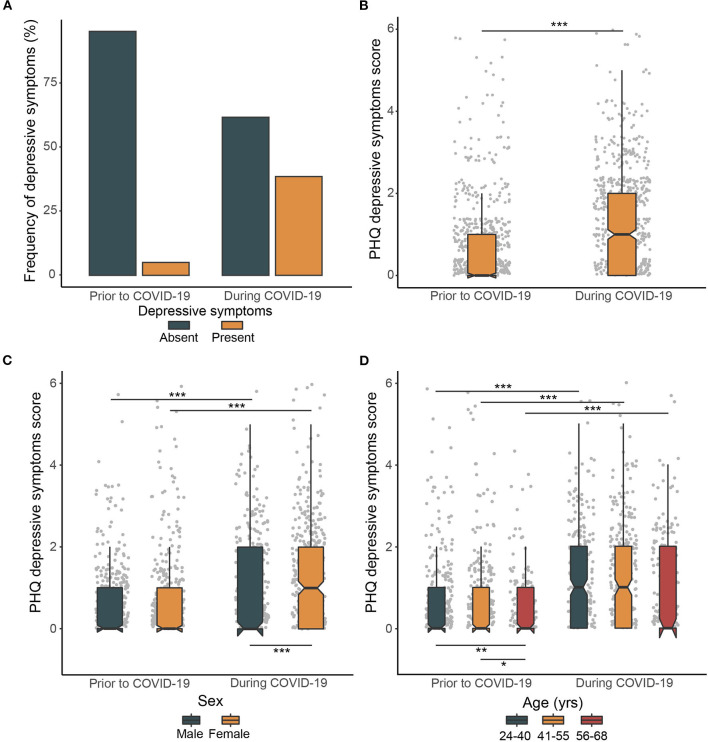
Figure 2.
Prevalence of severity of depressive symptoms prior to and during COVID-19 lockdown. (A) Frequency of depressive symptoms prior to and during COVID-19 lockdown. (B) Changes in the PHQ depressive symptoms score prior to and during COVID-19. (C) Sex differences in changes in the severity of depressive symptoms prior to and during COVID-19. (D) Age group differences in changes in the severity of depressive symptoms prior to and during COVID-19. The box plots with whiskers represent the median and the first and the third quartiles are extended by 1.5 times the interquartile range. Upper horizontal bars indicate significant differences in severity of depressive symptoms prior to and during COVID-19, lower horizontal bars indicate significant cross-sectional differences in severity of depressive symptoms between individual groups (*P < 0.05, **P < 0.01, ***P < 0.001).

