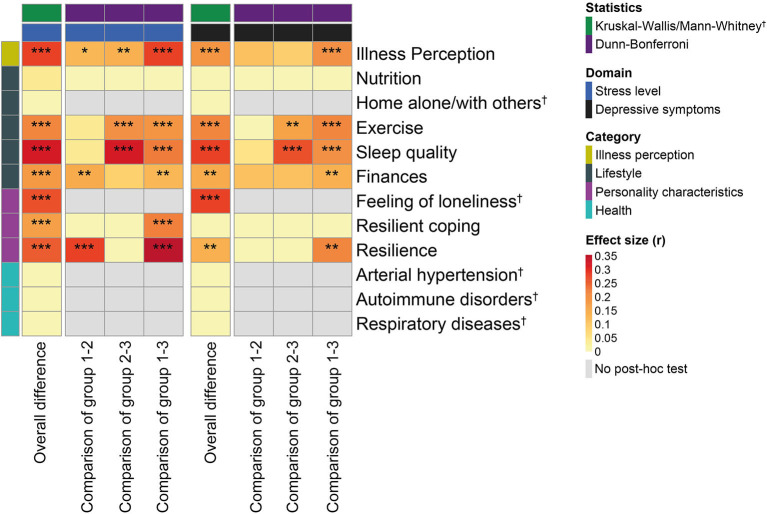
Figure 3.
Association between stress levels, severity of depressive symptoms, and potential underlying risk factors during the COVID-19 lockdown. Heatmap showing Pearson's r effect sizes with levels of significance based on a Kruskal–Wallis/Dunn–Bonferroni test (with adjustment for multiple comparisons) and whenever appropriate a Mann–Whitney U-test (*P < 0.05, **P < 0.01, ***P < 0.001). Group comparisons refer to post hoc tests where for illness perception, finances, resilient coping and resilience groups 1, 2, and 3 correspond to minor, moderate, and significant response, respectively, while for nutrition, exercise, and sleep quality groups 1, 2, and 3 correspond to improved, unchanged, and worsened response, respectively.

