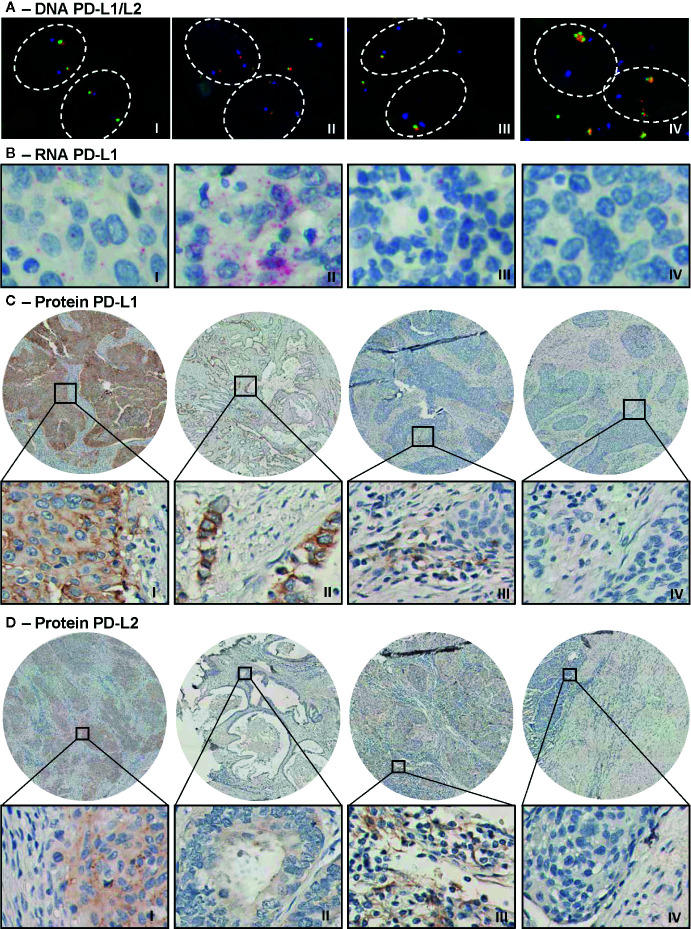
Figure 1.
Representative microscopic images of PD-L1/PD-L2 DNA FISH, PD-L1 RNAish and immunohistochemical PD-L1 and PD-L2 protein expression. (A) Microscopic images of a PD-L1/PD-L2 disomy (I), polysomy (II), monosomy/heterozygous deletion (III), and amplification (IV) case. Visualization of CD274 (PD-L1 locus) in green, of PDCD1LG2 (PD-L2 locus) in red, and of the centromeric region in blue. (B) Moderate (I, score = 3) and strong (II, score = 4) PD-L1 mRNA expression (in red) in tumor cells. Expression of PD-L1 mRNA was also observed in cells in stroma (III). The right panel (IV) shows a negative tumor for PD-L1 mRNA. (C) Strong PD-L1 expression (in brown) on tumor cells (I, H-score = 8) in an SCC core biopsy and an example of intermediate expression (II, H-score = 5) in an AC tumor. The third image (III) shows positive cells in stroma and the last image is a negative tumor for PD-L1. (D) Strong PD-L2 expression (in brown) on tumor cells in an SCC sample (I, H-score = 8) and weak PD-L2 expression on tumor cells in AC (II, H-score = 2). Image III shows positive stromal fields for PD-L2 protein and the last image shows a negative tumor for PD-L2.

