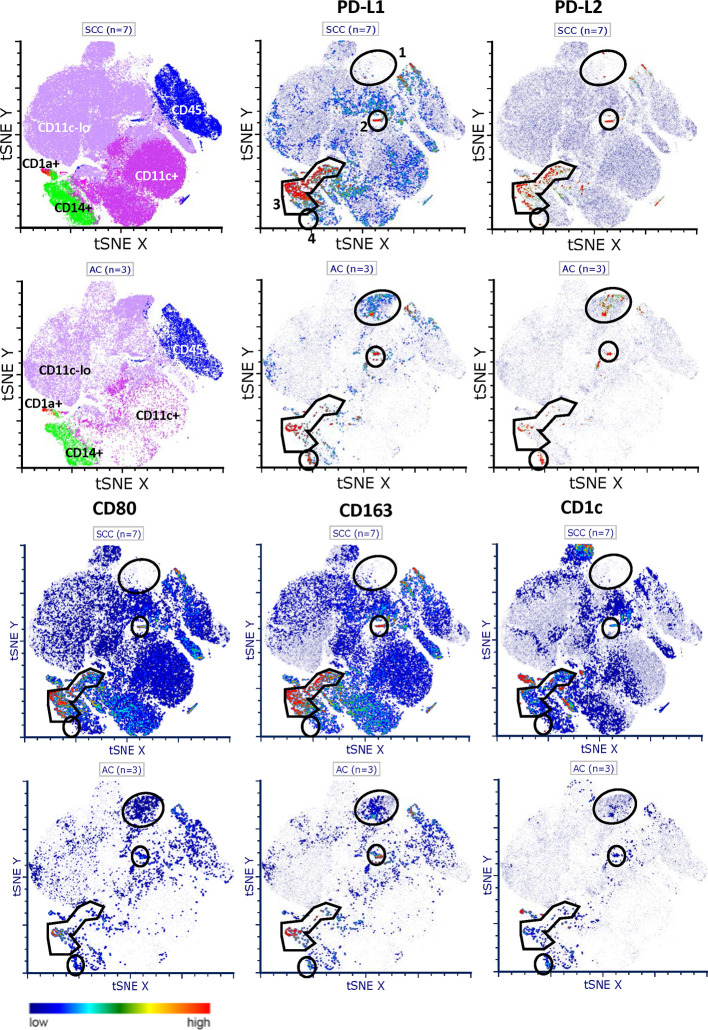
Figure 2.
t-SNE plots of PD-L1 and PD-L2 expression and distribution in SCC and AC. Comprehensive flowcytometric analysis on tumor digests of SCC (n = 7, top rows) and AC (n = 3, bottom rows). t-SNE analysis shows four PD-L1 and PD-L2 co-expressing macrophage-like populations, based on CD14 or CD163 positivity and low or absent CD1c expression. No. 1) a large population over-represented in AC with relatively high levels of PD-L1 and PD-L2 and low levels of CD80. No. 2) a small PD-L1+PD-L2+CD80−CD163+ M2-like macrophage population present in both SCC and AC. No. 3) most frequent population with high levels of both PD-L1 and PD-L2. In SCC only, high co-expression of CD80. No. 4) a small PD-L1+/PD-L2+ population in AC with low levels of CD80.

