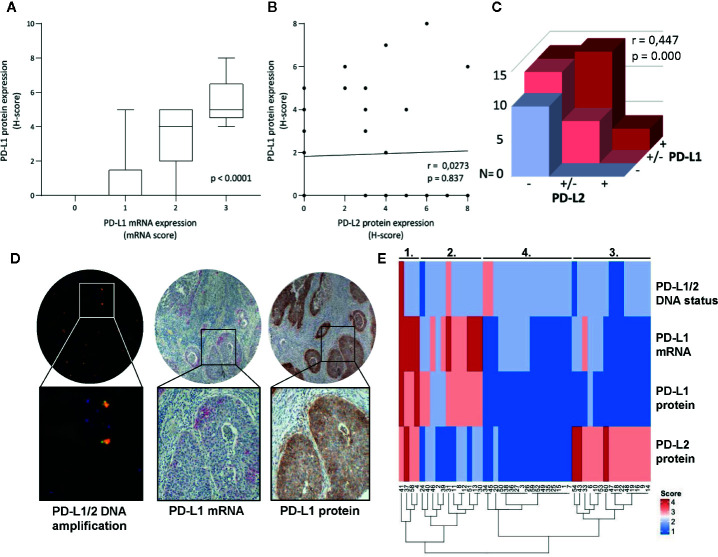
Figure 3.
Comparison of DNA status, mRNA- and protein expression of PD-L1/PD-L2. (A) Higher mRNA expression levels of PD-L1 in tumor cells associated with higher PD-L1 protein expression on tumor cells as assessed by the H-score. (B) No correlation was found between PD-L1 and PD-L2 protein expression on tumor cells as assessed by the H-score (Spearman r = 0.0273, p = 0.837). (C) Correlation between PD-L1 and PD-L2 protein expression on cells in stroma (Spearman r = 0.447, p = 0.000). (D) Microscopic images of the case with PD-L1/PD-L2 DNA amplification and accordingly high mRNA PD-L1 expression (in red, >10 dots/tumor cell) and high PD-L1 protein expression (in brown, H-score = 8). (E) Heatmap cluster analysis based on PD-L1/PD-L2 DNA status, PD-L1 mRNA-, PD-L1 protein-, and PD-L2 protein expression on tumor cells (n = 48).

