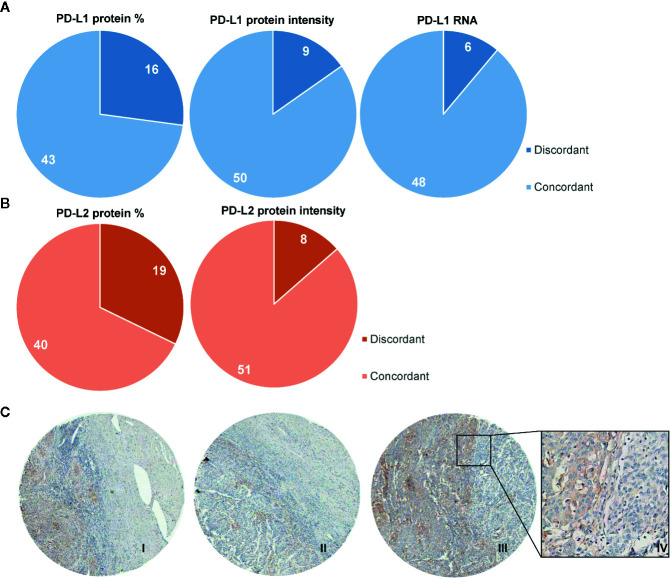
Figure 4.
Heterogeneity of protein expression and mRNA within TMA cores. Diagrams showing the number of cases where discordant scores were given to TMA core biopsies derived from one patient. (A) In 16/59 patients, a different percentage of PD-L1 expression was observed, based on 5 categories (0: 0%–1%; 1: 1%–10%; 2: 11%–25%; 3: 26%–50%; 4: 51%–75%; 5: 76%–100%; left panel). 9/59 patients were scored with different intensities of PD-L1, based on 4 categories (0: negative; 1: weak; 2: clear; 3: strong; middle panel). In 6/54 patients different scores were given for mRNA PD-L1, based on 5 categories (0: no dots; 1: 1–3 dots per tumor cell in <10% of tumor fields; 2: 1–3 dots per tumor cell in ≥ 10% of tumor fields; 3: 4–10 dots per tumor cell; 4: ≥10 dots per tumor cell). (B) 19/59 patients had discordant scores for PD-L2 protein percentages on tumor cells. (C) 8/59 patients had discordant scores for PD-L2 protein expression based on intensity. Immunohistochemical example of discordant PD-L1 expression pattern (in brown) on tumor cells (I, II, and III with H-scores of 5, 3, and 6, respectively) with also a representative example of heterogeneity within one core (IV).

