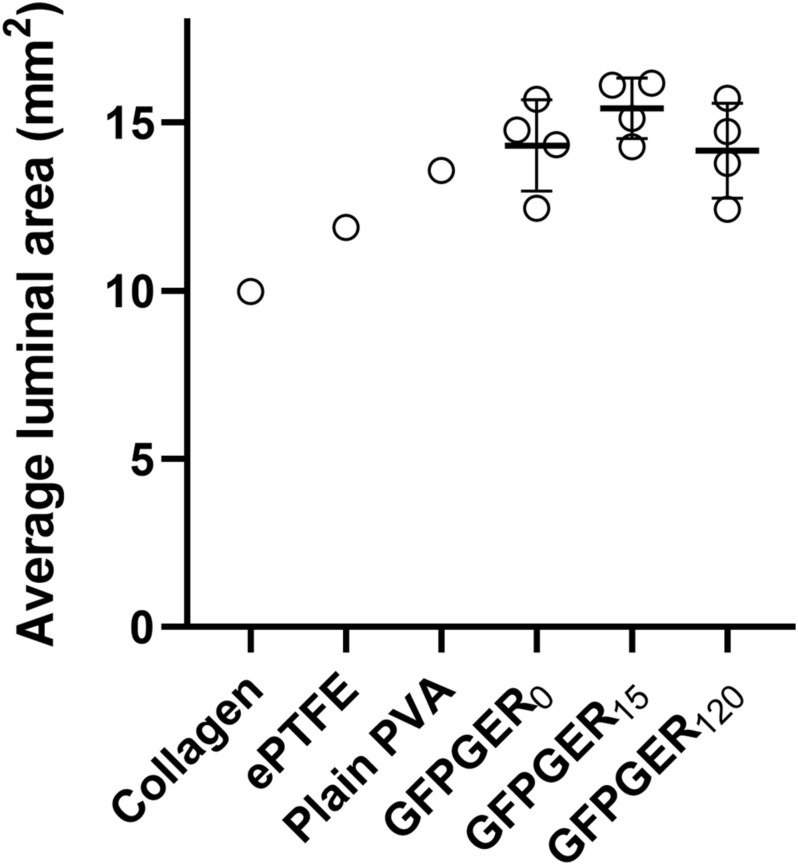
FIGURE 10.
Average luminal area of grafts after exposure to whole flowing blood in the ex vivo shunt. Collagen (n = 1), ePTFE (n = 1), plain PVA (n = 1), GFPGER0, GFPGER15, and GFPGER120 (all covalently modified GFPGER PVA samples were n = 4) grafts were analyzed for the average cross-sectional area per slice of the lumen. Data are presented as the mean ± SD of the average luminal area. Statistical analysis was performed only on experimental (GFPGER) samples using a one-way ANOVA. No statistical differences were observed.

