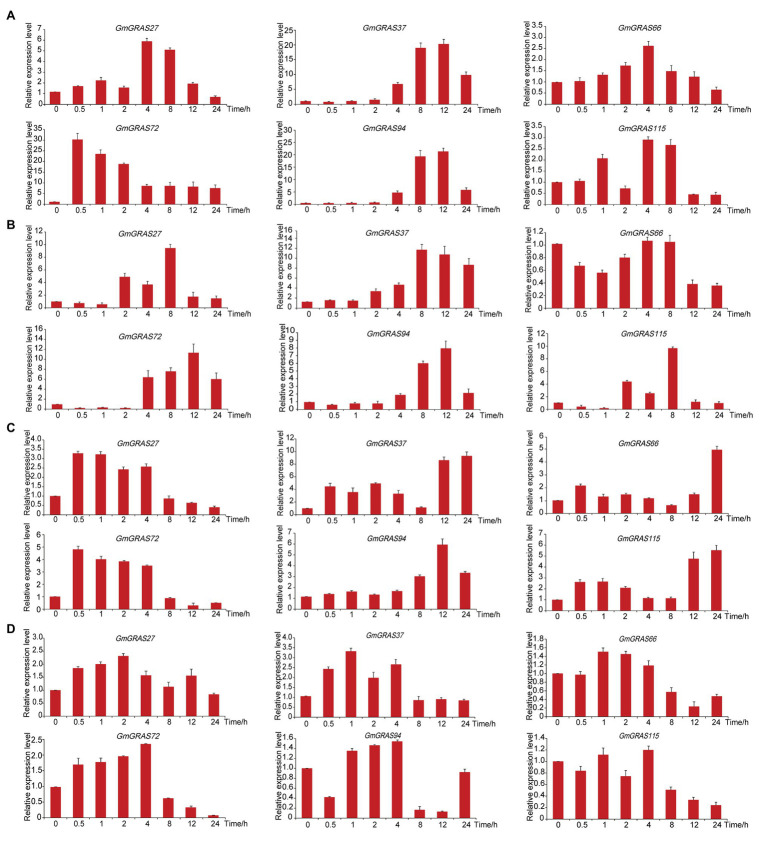
Figure 10.
Expression patterns of GmGRAS genes under drought, salt, abscisic acid (ABA), and brassinosteroid (BR) treatment. (A–D) Expression levels of six GmGRAS genes, as measured using quantitative real-time PCR (qRT-PCR), under drought (A), NaCl (B), ABA (C), and BR (D) treatment applied for 0, 0.5, 1, 2, 4, 8, 12, and 24 h. qRT-PCR data were normalized using the soybean Actin gene (U60506) and are displayed relative to 0 h. The x-axes show the duration of treatment and y-axes depict relative expression level (error bars indicate SD). The data are shown as means of three biology repeats ± SD.

