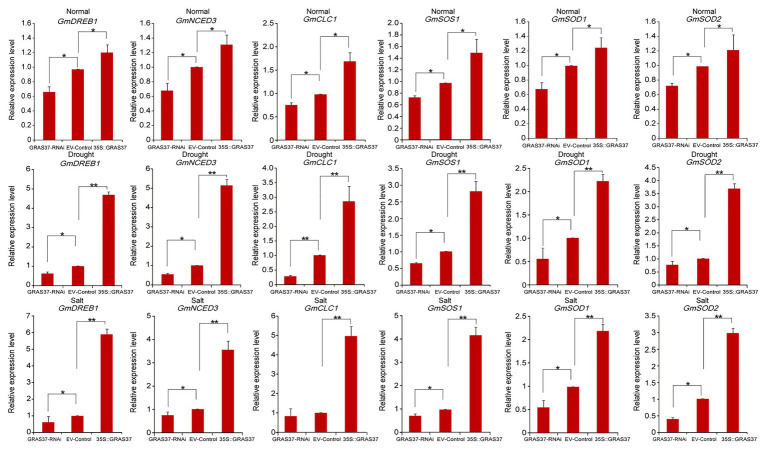
Figure 13.
Expression levels of six stress-responsive genes in transgenic GmGRAS37 soybean hairy root plants under normal conditions, drought stress, and 250 mM NaCl treatment determined by qRT-PCR. Vertical bars indicate ±SD of three replicates. ∗ (p < 0.05) and ∗∗ (p < 0.01) indicate significant differences determined by Student’s t-test.

