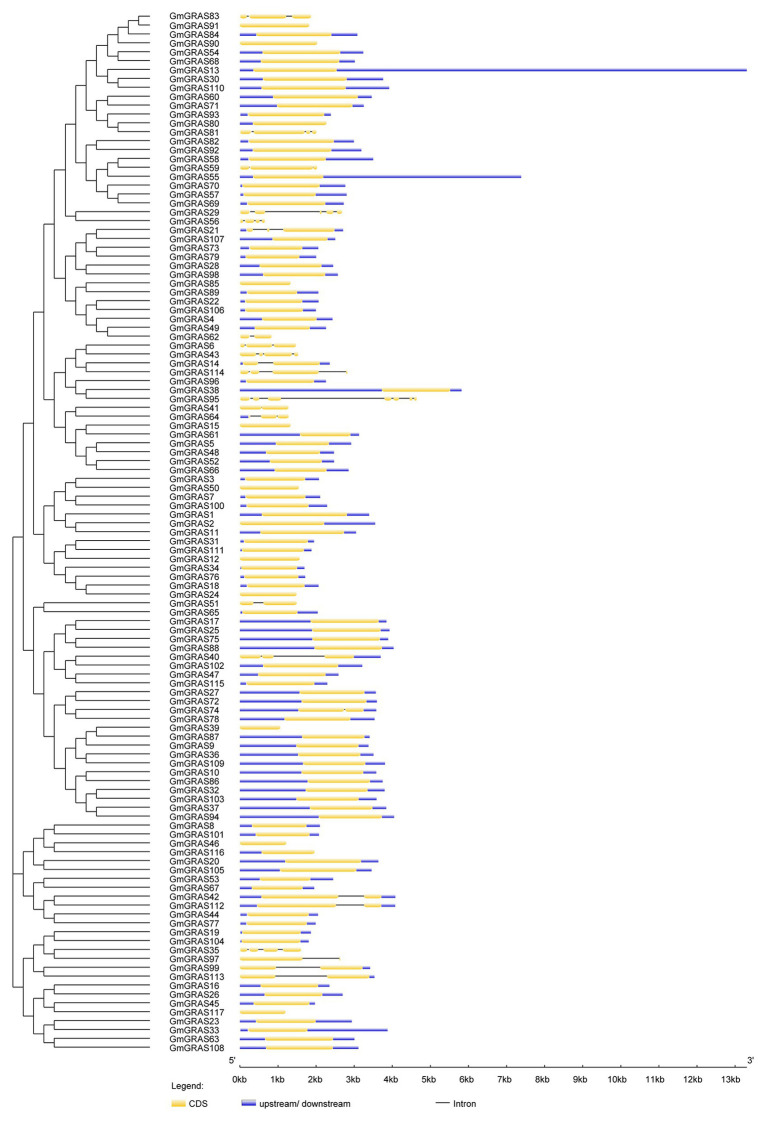
Figure 4.
Phylogenetic relationships and structures of the 117 GmGRAS proteins. The phylogenetic tree was constructed using MEGA7.0 software; the different classes of GRAS proteins make up separate clades. The schematic diagram indicates the gene structure. Introns and exons are indicated by black lines and yellow boxes, respectively. The lengths of introns and exons of each gene are displayed proportionally.

