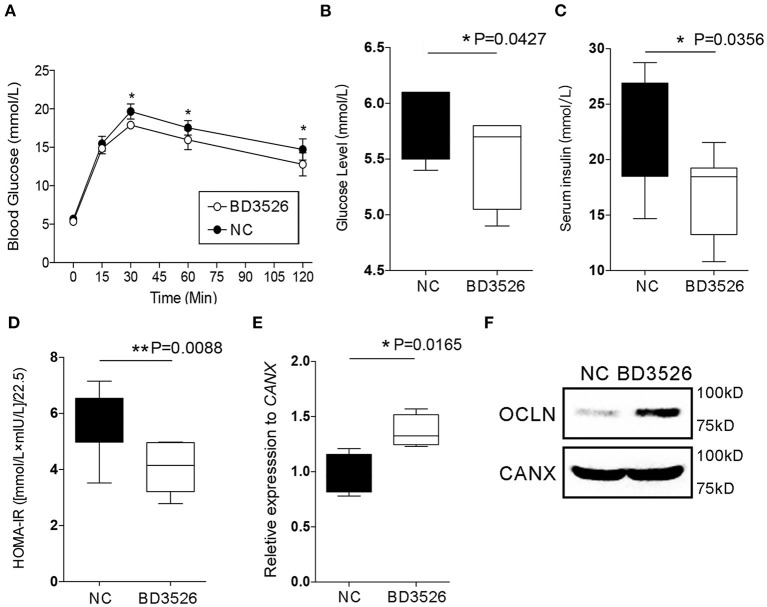
Figure 2.
Observation of type 2 diabetes mellitus symptoms. (A) Goto–Kakizaki (GK) rats in the BD3526 and NC groups were tested for glucose tolerance. Blood glucose concentration was measured at 0, 15, 30, 60, and 120 min (n = 8, *P < 0.05, mean ± SEM). (B) Serum blood glucose was measured (*P < 0.05, mean ± SEM). (C) Serum insulin was measured (*P < 0.05, mean ± SEM). (D) Statistical analysis of the insulin resistance index (**P < 0.01, mean ± SEM). (E) Changes in the expression of the occludin (OCLN) gene were detected by qPCR (*P < 0.05, mean ± SEM). (F) Changes in the expression of the OCLN were detected by Western Blot.

