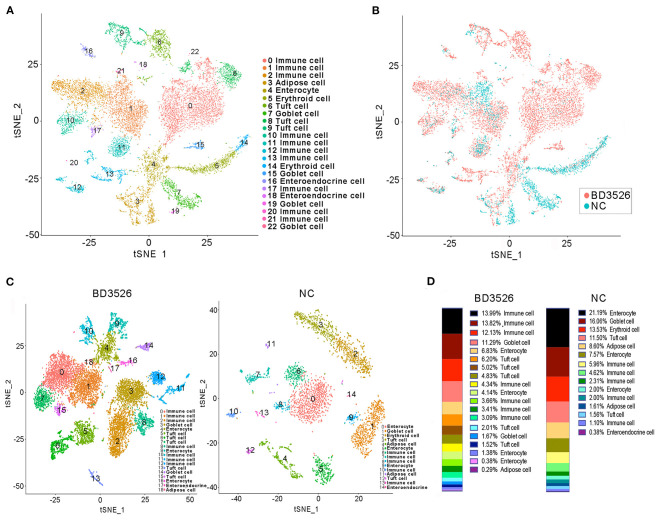
Figure 3.
t-SNE clustering analysis of the single-cell RNA sequencing (scRNA-seq) experiment. (A) t-SNE clustering of all cells in the BD3526 and NC groups after integration. Each color represents a different subidentity of cells. (B) Specific distribution of cells in the BD3526 and NC groups in t-SNE clustering. Red indicates cells from the BD3526 group, and cyan indicates cells from the NC group. (C) t-SNE cluster analysis was performed separately in the BD3526 and NC groups. Each color represents a different subidentity of cells. (D) Proportions of cells with different subidentities in the BD3526 and NC groups.

