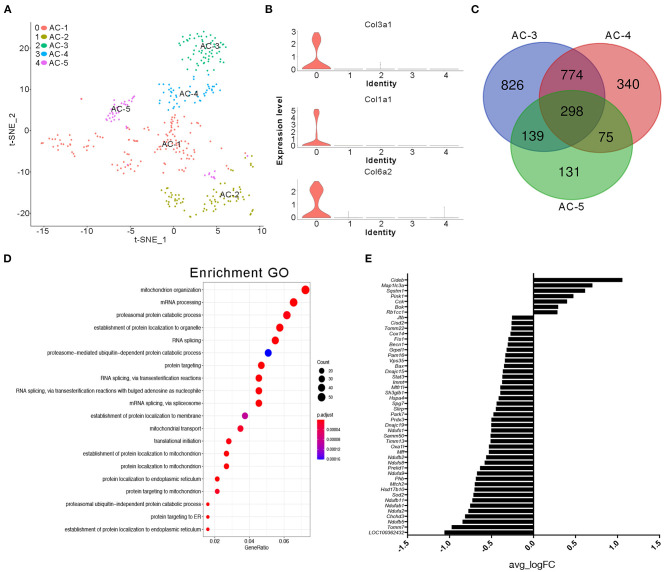
Figure 4.
Cluster analysis of adipocytes in the NC group. (A) t-SNE clustering analysis of adipocytes in the NC group. Each color represents a different subidentity of cells. (B) Violin plots of the expression density of Col3a1, Col1a1, and Col6a2 in adipocytes. (C) Specific marker genes for AC-3, AC-4, and AC-5 cell subidentities. (D) Gene Ontology (GO) functional clustering of genes specifically expressed in AC-3 cells. (E) Expression of mitochondrial genes in AC-3 cells.

