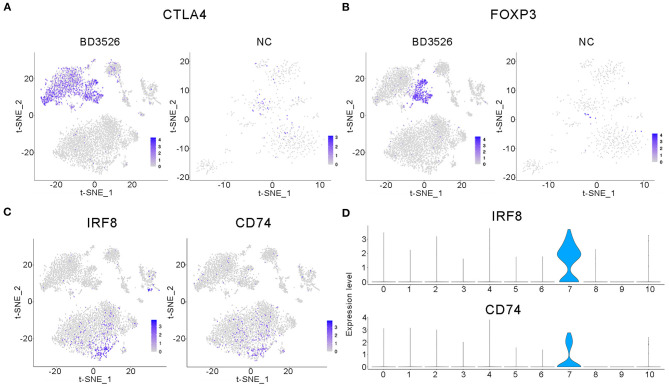
Figure 6.
Characteristic analysis of immune cells in the BD3526 group. (A,B) Analyses of the expression and distribution of CTLA4 and FOXP3 genes in regulatory T (Treg) cells in the BD3526 group and the NC group, respectively, using the t-SNE diagram. (C,D) The expression distribution of IRF8 and CD74 genes in dendritic cells (DCs) in the BD3526 and NC groups, respectively, using t-SNE figures and violin plots.

