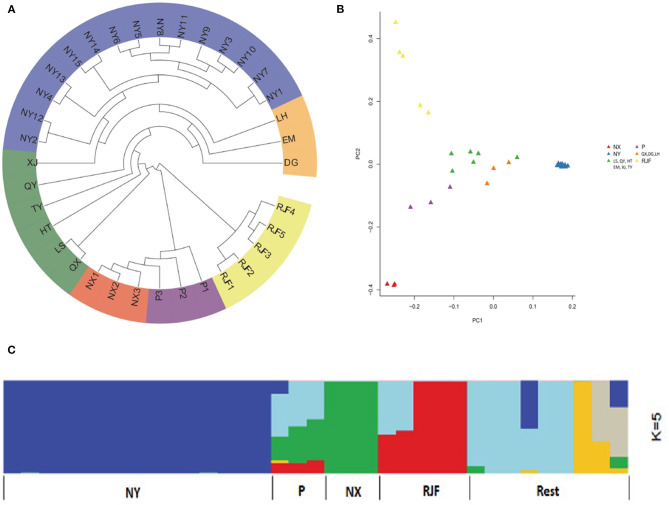
Figure 1.
Population genetics analyses of 35 chickens. (A) Neighbor-joining tree constructed using p-distances between individuals. (B) Principal component analysis (PCA) of 35 chickens. (C) Genetic structure of chicken breeds. The length of each colored segment represents the proportion of the individual's genome from ancestral populations (k = 5). The population names are at the bottom of the figure. Dagu (DG), Emei Black (EM), Hetian (HT), Luhua (LH), Longsheng (LS), Nixi (NX), Niya (NY), Piao (P), Qianxiang (QX), Qingyuan (QY), Taoyuan (TY), Xianju (XJ), and Red jungle fowl (RJF).

