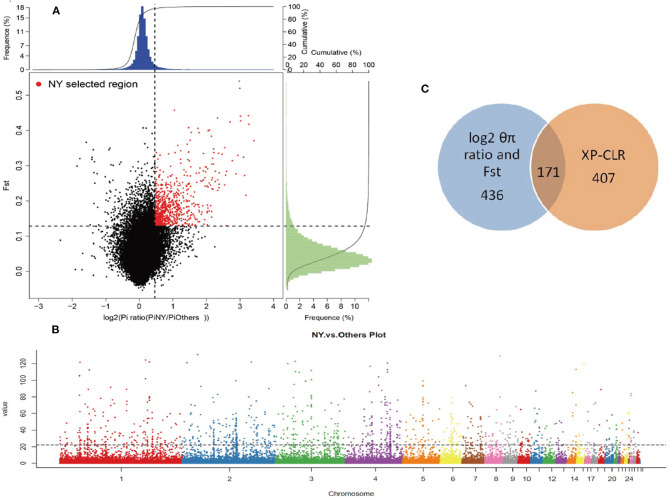
Figure 2.
Genomic regions with strong selective sweep signals in NYs. (A) Distribution of log2 (θπ ratio [θπ, Others / θπ, NYs]) (top 5% outliers, log2 [θπ ratio] > 0.46) and FST values (top 5% outliers, FST > 0.13), which are calculated in 40 kb windows sliding in 20 kb steps. The selected regions for NYs were indicated by red dots. (B) The Manhattan plot shown candidate genes positively selected in XP-CLR method between NYs and Others. The dotted line indicates the top 1% threshold. The data points above the straight line (corresponding to the top 1% of empirical values) are genomic regions under selection in NYs. (C) A total of 171 candidate genes in NYs were identified by combining three methods (including log2 [θπ ratio], FST and XP-CLR) simultaneously and are shown using Venn diagram components.

