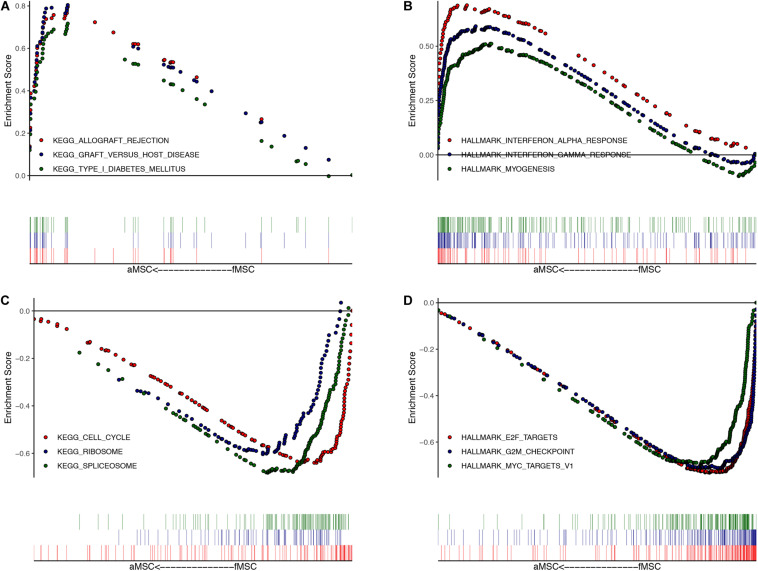
FIGURE 2.
Gene set enrichment analysis (GSEA) for DEGs. The top three enriched gene sets (according to GSEA enrichment score) in aMSC group: (A) for KEGG; (B) for HALLMARK. The top three enriched gene sets (according to GSEA enrichment score) in fMSC group: (C) for KEGG; (D) for HALLMARK. All gene sets are significantly enriched at a false discovery rate (FDR) < 0.05. The location of the vertical bar shows the occurrence of the gene in the ranked list.

