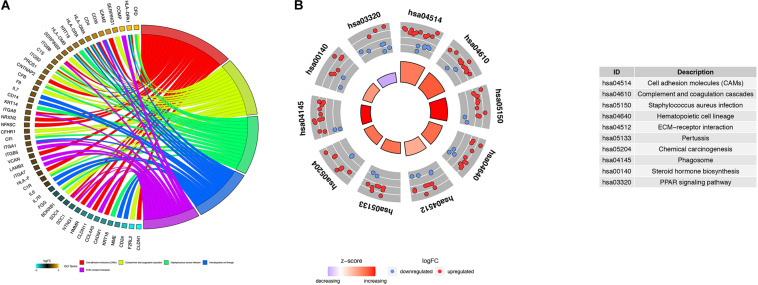
FIGURE 5.
Kyoto Encyclopedia of Genes and Genomes (KEGG) analysis of robust DEGs. Chord plot (A) and circle plot (B) show the relationship between genes and KEGG pathways. (A) Chord plot depicting the relationship between genes and the top five KEGG pathways. (B) Circle plot depicting the distribution of genes in the top 10 KEGG pathways.

