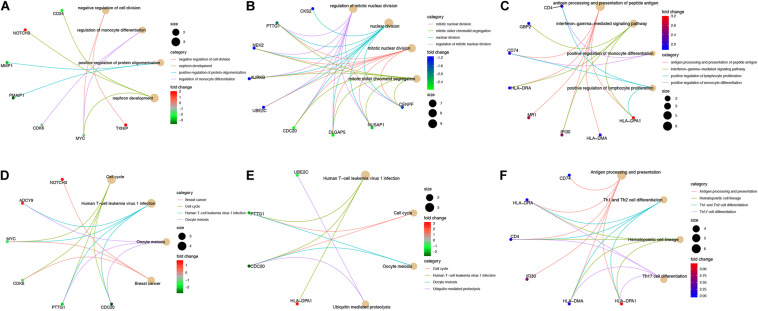
FIGURE 8.
Interactive genes of hub-genes were filtered by a Pearson correlation coefficient > 0.5 and GO (A–C) and KEGG pathway (D–E) analyses were performed for these genes. GO and KEGG analyses for (A,D) interactive genes of MYC; (B,E) interactive genes of KIF20A; (C,F) interactive genes of HLA-DRA and HLA-DPA1. Cut off = adjust P < 0.05, the top four are shown in plot.

