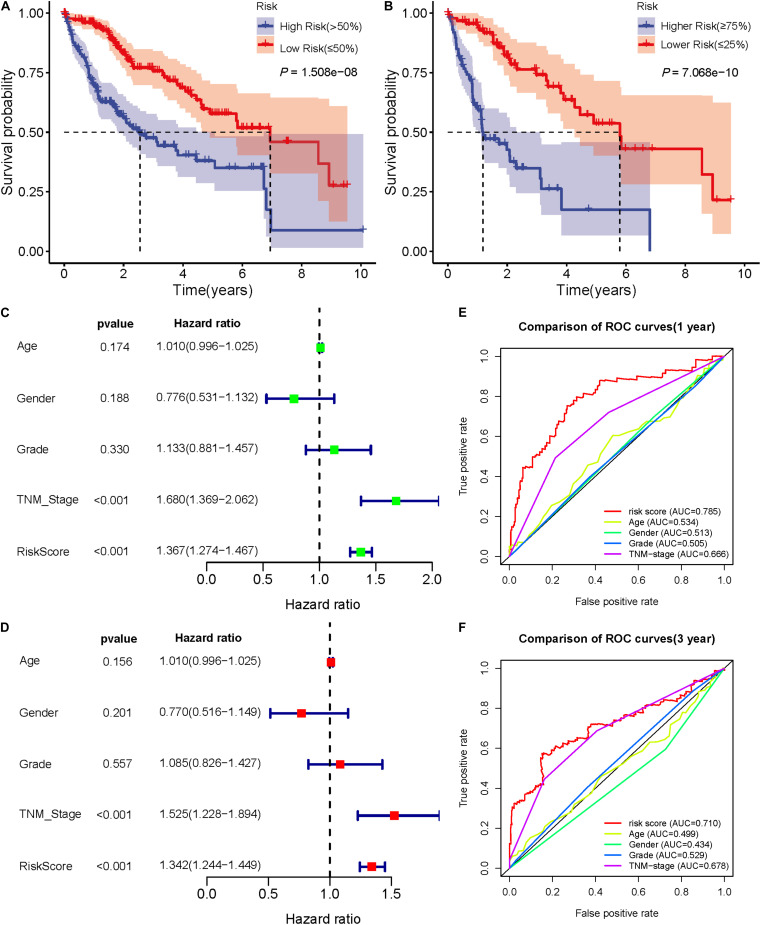
FIGURE 5.
Validation of the prognostic signature of seven DEARlncRNAs. (A) The K-M curve reflects that the OS of high-risk HCC patients is significantly lower than that of low-risk patients (P < 0.0001). (B) The K-M curve reflects that the OS of higher-risk patients is also significantly worse than that of lower-risk patients (P < 0.0001). (C) Forest plot reflects the univariate Cox analysis of the relationship between the clinical features, risk score and OS of HCC patients. Both TNM stage and risk score significantly affect the prognosis of HCC patients (P < 0.001).(D) Forest plot reflects multivariate Cox analyzed the relationship between the clinical features, risk score and OS of HCC patients. TNM stage and risk score are independent prognostic risk factors for HCC (P < 0.001). (E)The 1-year time-dependent ROC curve shows that the prediction accuracy of risk score is higher than other clinical features (AUC = 0.785). (F) The 3-year time-dependent ROC curve reflects that the prediction accuracy of risk score is higher than other clinical features (AUC = 0.710).

