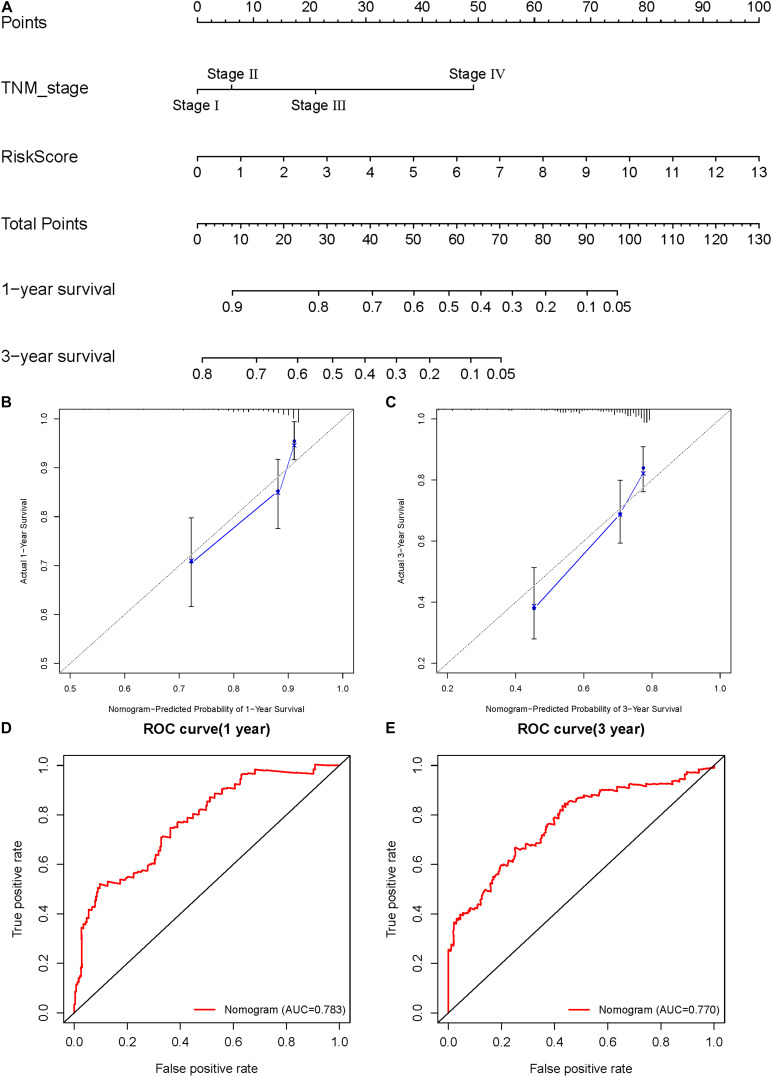
FIGURE 8.
Construction and validation of the nomogram. (A) Calculate the scores of each item of HCC patients according to the nomogram, and the total scores obtained after addition can predict the 1- and 3-year survival probability. (B,C) The 1- and 3-year calibration curves of the nomogram. (D,E) The ROC curves of 1-and 3-year nomogram (AUC = 0.783 of 1 year, AUC = 0.770 of 3 years).

