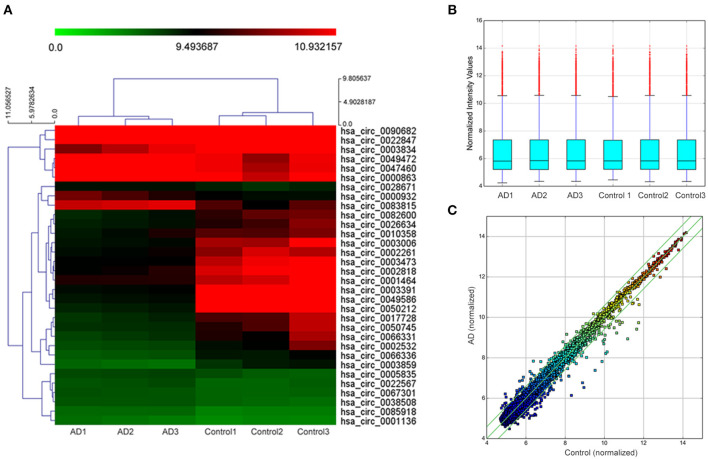
Figure 1.
Hierarchical clustering dendrogram and heat map. (A) Hierarchical clustering based on the expression value of circularRNA (circRNA) shows a distinguishable gene expression profile among the samples. The green strip indicates low relative expression, and the red strip indicates high relative expression. (B) Box plots show the distribution of circRNAs in the two groups, which were similar after normalization. (C) Scatter plot indicates a change of >1.5-fold in circRNA levels between the two groups.

