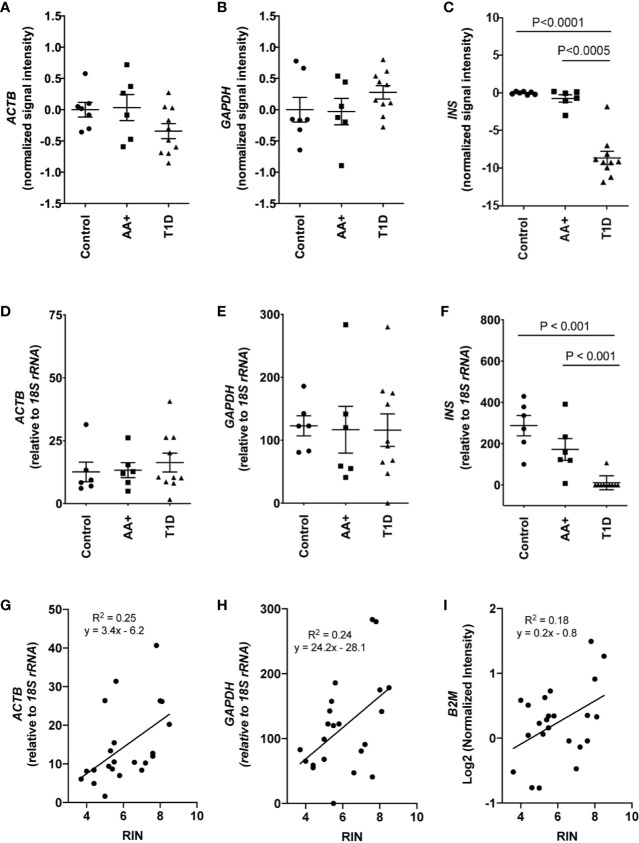
Figure 2.
Comparison of house-keeping gene and INS expression in control, AA+ and T1D samples. (A–C) Microarray data showing the normalized signal intensity for ACTB (A), GAPDH (B) and INS (C) in individual control, AA+ and T1D samples. No difference in ACTB and GAPDH expression was observed between groups. INS expression was significantly lower in T1D patients. (D–F) QPCR analysis showing similar data for ACTB (D), GAPDH (E), and INS (F) expression. (G–I) Graphs showing the expression of house-keeping genes ACTB, GAPDH, and B2M against RIN values. Statistical analysis was performed using the Moderated T-test (panel A-C) or the two-tailed Mann-Whitney test (Panel D–F).

