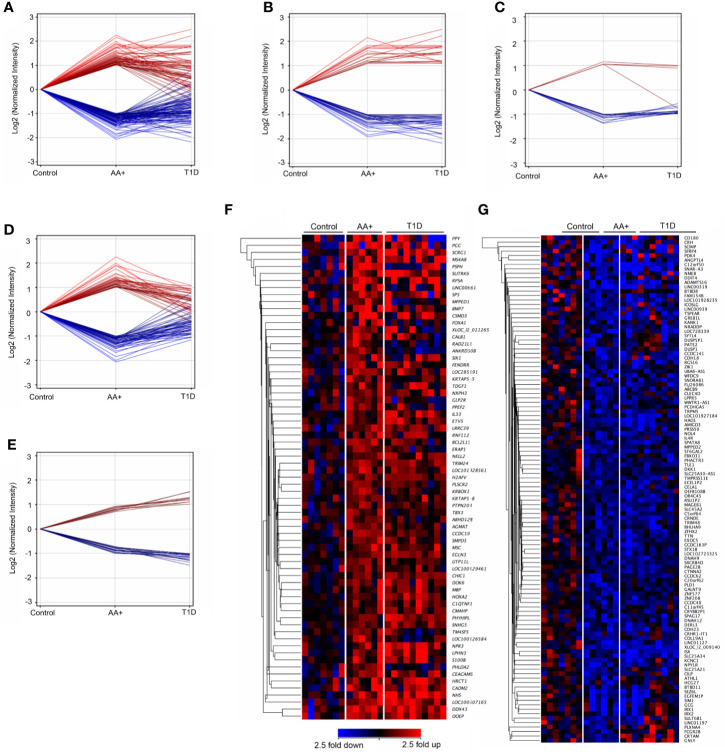
Figure 3.
Differentially expressed genes in the pancreata of AA+ individuals compared to controls. 155 genes (59 upregulated and 96 downregulated) were significantly changed by at least 2-fold in the pancreata of AA+ individuals vs. controls (A). Among these, 48 were changed by >2-fold (B), 19 were changed by <2-fold (C), and 88 were unchanged (D) in the pancreata of T1D patients vs. controls. An additional 28 genes were significantly changed by 1.5 to 2-fold in AA+ vs. controls and >2-fold in T1D vs. controls (E). Gene expression heatmaps of the upregulated (F) and downregulated (G) genes from panels A and E are shown. These genes were further analyzed for biological function (See Supplementary Table 2 and Table 3).

