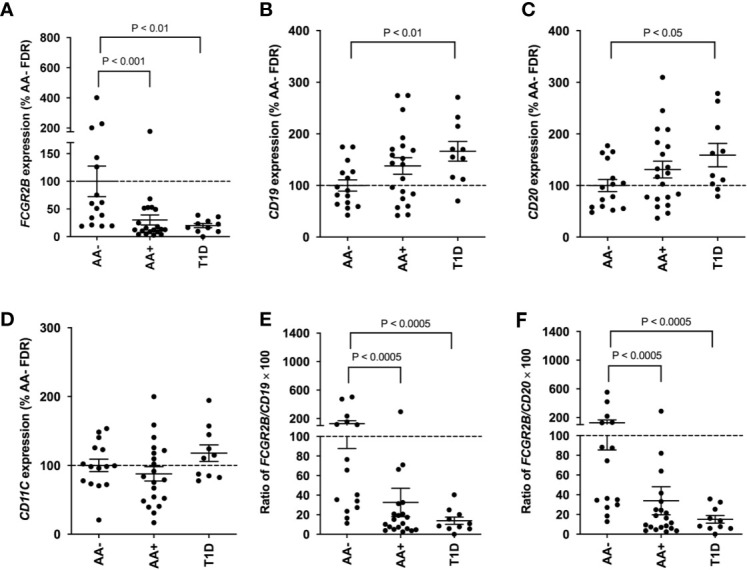
Figure 7.

Loss of FCGR2B gene expression in the peripheral blood of AA+ FDRs and T1D patients. QPCR data showing FCGR2B (A), CD19 (B), CD20 (C), and CD11c (D) expression in the whole blood of AA- FDRs, AA+ progressors, and T1D patients. FCGR2B expression is also shown relative to CD19 (E) and CD20 (F) expression for each individual. Statistical analysis was performed using the two-tailed Mann-Whitney test.
