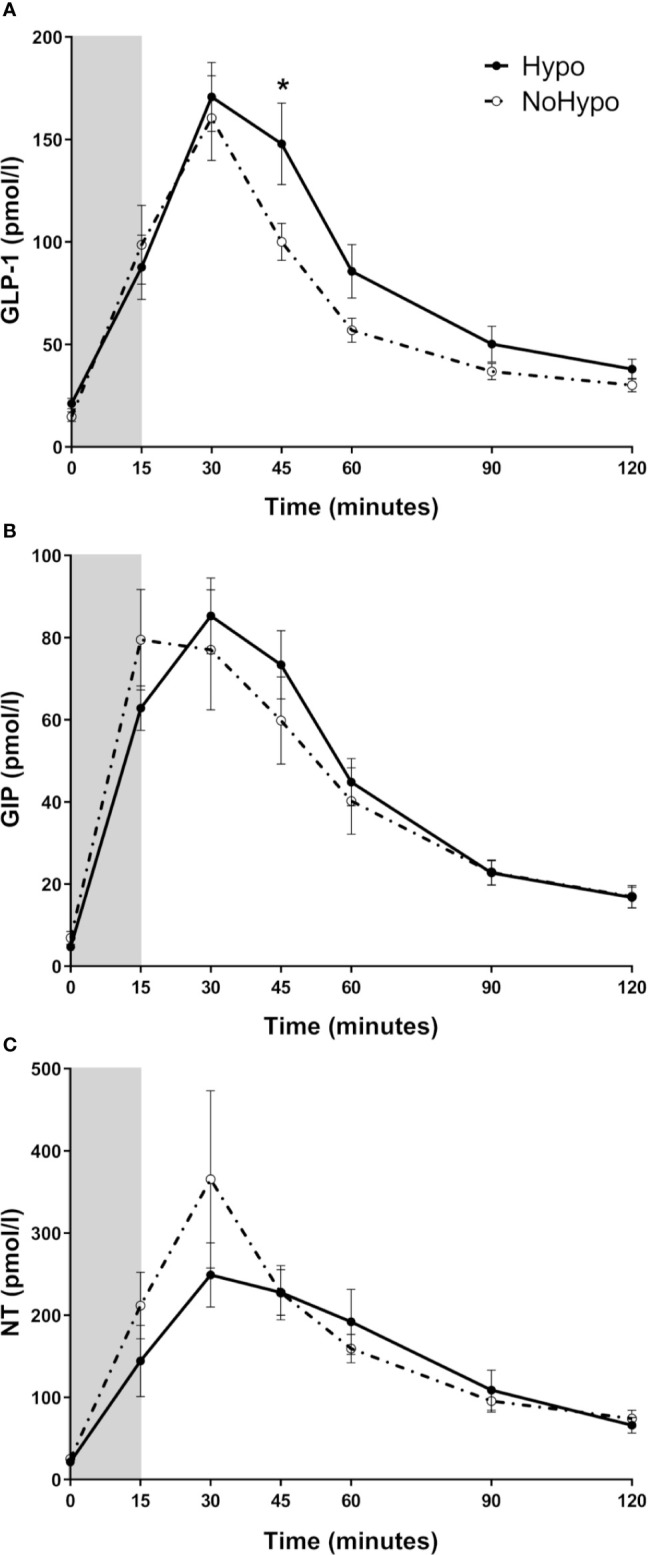
Figure 3.

Plasma levels of GLP-1 (A), GIP (B), and NT (C), in post-RYGB patients according to the MMTT response (Hypo and NoHypo). Data is presented as mean ± SEM. Statistically significant differences are marked as *p < 0.05. GIP, glucose-dependent insulinotropic polypeptide; GLP-1, glucagon-like peptide-1; NT, Neurotensin.
