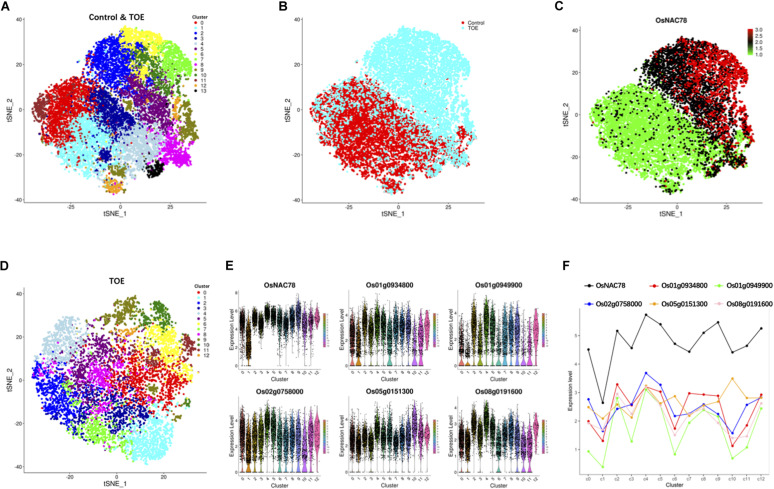
FIGURE 3.
Cluster and correlation analysis of rice leaf cells. (A) t-SNE visualization identifying 14 clusters in the control and TOE. Each dot denotes a single cell. (B) t-SNE visualization identifying the profiles of control cells and TOE cells. Each dot denotes a single cell. (C) t-SNE visualization of OsNAC78’s expression in the control and TOE. Each dot denotes a single cell. The depth of color indicates differences in the expression levels. (D) t-SNE visualization identifying 13 clusters in the TOE. Each cluster contained from 74 to 1,077 cells. Each dot denotes a single cell. (E) Violin plot showing the expression levels of OsNAC78 and 5 of the 65 candidate genes whose expression correlated with that of OsNAC78 in the TOE. Each dot denotes a single cell. (F) Line chart showing the average expression levels of OsNAC78 and 5 of the 65 candidate genes whose expression correlated with that of OsNAC78 in each cluster of the TOE. A dot represents the mean value of a cluster.

