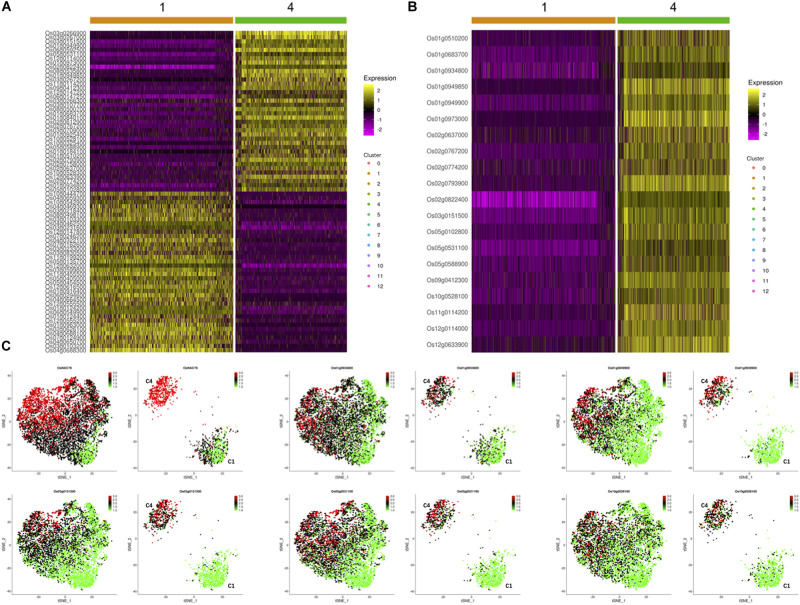
FIGURE 4.
The expression profiles of OsNAC78’s candidate targets in the TOE. (A) Heat map illustrating the transcript levels of 78 DEGs between clusters 1 and 4, which had the lowest and highest OsNAC78 expression levels, respectively. Os02g0822400, OsNAC78. The bars at the top of the heat map indicate the clusters in the TOE. (B) Heat map illustrating the transcript levels of OsNAC78 and 19 overlapping genes generated from 35 strongly correlated genes and 78 DEGs between clusters 1 and 4. Os02g0822400, OsNAC78. The bars at the top of the heat map indicate the clusters in the TOE. (C) t-SNE visualization of OsNAC78 and 5 of the 19 overlapping genes in the TOE and isolated from cluster 1 or 4. C1, cluster 1; C4, cluster 4. Each dot denotes a single cell. The depth of color indicates differences in expression levels.

