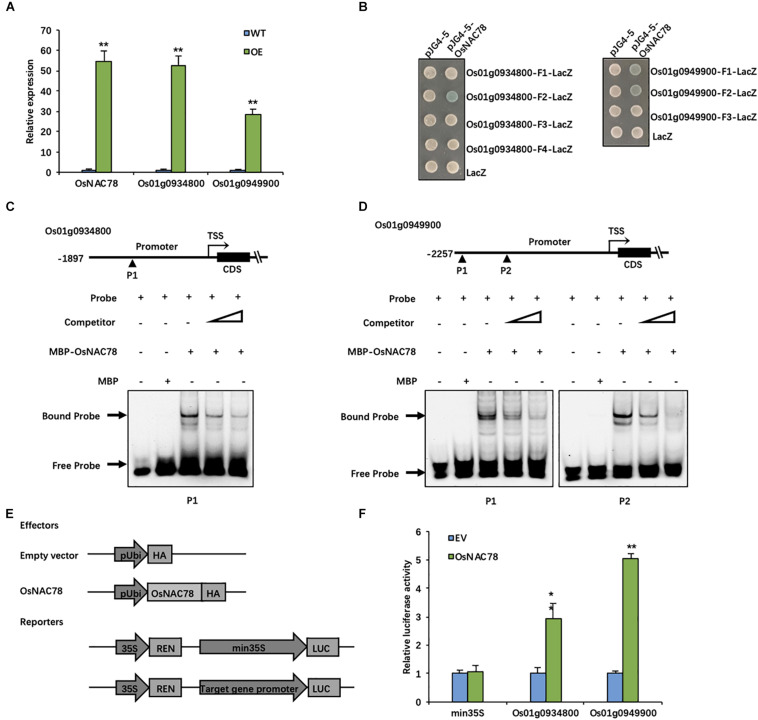
FIGURE 5.
OsNAC78 directly binds to the promoters of Os01g0934800 and Os01g0949900. (A) The relative expression levels of OsNAC78, Os01g0934800, and Os01g0949900 were detected in wild-type (WT) and OsNAC78 overexpression (OE) lines as assessed by qRT-PCR. Data are presented as means ± SDs (n = 3) and were analyzed using Student’s t-test; The asterisks indicate significant differences (**P < 0.01). (B) The interactions between OsNAC78 and the promoter fragments of Os01g0934800 (represented as F1–4) and Os01g0949900 (represented as F1–3) were shown using a yeast one-hybrid assay. Yeast cells were grown on SD/-Ura/-Trp–X-gal medium. pJG4-5 was used as an effector vector. pLacZi (LacZ) was used as a reporter vector. (C) The interaction between OsNAC78 and a probe (P1) containing one CGTG motif in the Os01g0934800 promoter was shown using EMSA. Unlabeled probe was used as a competitor. The triangle denotes an increasing dose. MBP was used as a control. (D) The interaction between OsNAC78 and a probe (P1) containing two CGTG motifs or a probe (P2) containing one CGTG motif in the Os01g0949900 promoter was shown using EMSA. Unlabeled probe was used as a competitor. The triangle denotes an increasing dose. MBP was used as a control. (E) Schematic showing the vectors used for identifying interactions between OsNAC78 and the promoters of Os01g0934800 and Os01g0949900 using a dual-luciferase (LUC) assay. OsNAC78 was inserted into the pRTVcHA vector as an effector. The promoters of Os01g0934800 and Os01g0949900 were independently inserted into the pGreenII 0800-LUC vector as reporters, and Renilla luciferase (REN) was used as an internal control. (F) The relative LUC activity levels indicated the promoter activities of min35S, Os01g0934800 and Os01g0949900 in the absence and presence of OsNAC78 in protoplasts. The min35S promoter was used as a control. EV, empty vector. Data are presented as means ± SDs (n = 3) and were analyzed using Student’s t-test; The asterisks indicate significant differences (**P < 0.01). *P < 0.05.

