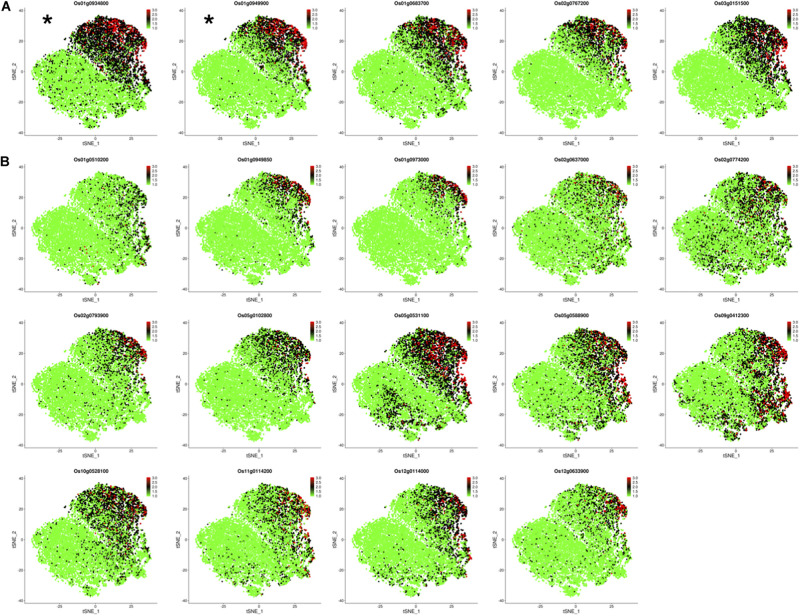
FIGURE 6.
The expression profiles of 19 candidate genes in the control and TOE. (A) t-SNE visualization of five candidate genes having expression trajectories that were highly similar to that of OsNAC78. *OsNAC78 target. Each dot denotes a single cell. The depth of color indicates different expression levels. (B) t-SNE visualization of 14 candidate genes having expression trajectories that were somewhat similar to that of OsNAC78. Each dot denotes a single cell. The depth of color indicates different expression levels.

