Figure 1.
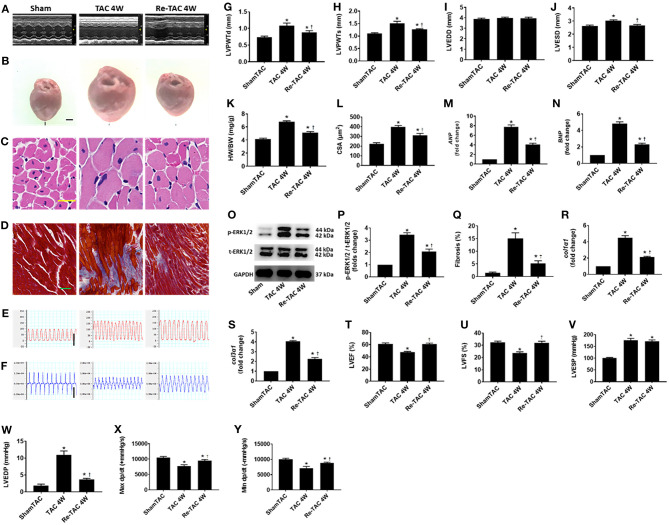
Hypertrophic preconditioning improves cardiac morphological changes and function in pressure overload hearts. (A) M-mode echocardiography from Sham, TAC 4W, and Re-TAC 4W mice. (B) Gross appearance of hearts. Scale bar = 1 mm. (C) Cardiomyocytes stained by H&E. Scale bar = 20 μm. (D) Cardiac fibrosis stained by Masson's trichrome. Scale bar = 50 μm. Representative images of (E) LV pressure and (F) contraction and relaxation velocity (dp/dt). Scale bar = 100 mmHg for pressure, scale bar = 10,000 mmHg/s for dp/dt. (G,H) LV end-diastolic (LVPWTd) and end-systolic (LVPWTs) posterior wall thickness, respectively. (I,J) LV end-diastolic (LVEDD) and end-systolic (LVESD) dimension, respectively. (K) Heart weight-to-body weight ratio (HW/BW). (L) Cross-sectional area (CSA) of cardiomyocytes. (M,N) Real-time quantitative PCR analyses for the gene expression of atrial natriuretic peptide (ANP) and brain natriuretic peptide (BNP), respectively. Representative images (O) and densitometric assessment (P) of Western blot for ERK1/2 activation. (Q) Quantification of collagen staining expressed as % area. Gene expression of makers of cardiac fibrosis (R) collagen type I alpha 1 (col1α1) and (S) collagen type 3 alpha 1 (col3α1). Echocardiographic measurements of (T) LV ejection fraction (LVEF) and (U) LV fractional shortening (LVFS). Invasive hemodynamic assessment of (V,W) LV end-systolic (LVESP) and end-diastolic (LVEDP) pressure, respectively. (X,Y) Maximum (Max dp/dt) and minimum (Min dp/dt) value of LV dp/dt, respectively. *P < 0.05 vs. Sham TAC; †P < 0.05 vs. TAC 4W.

