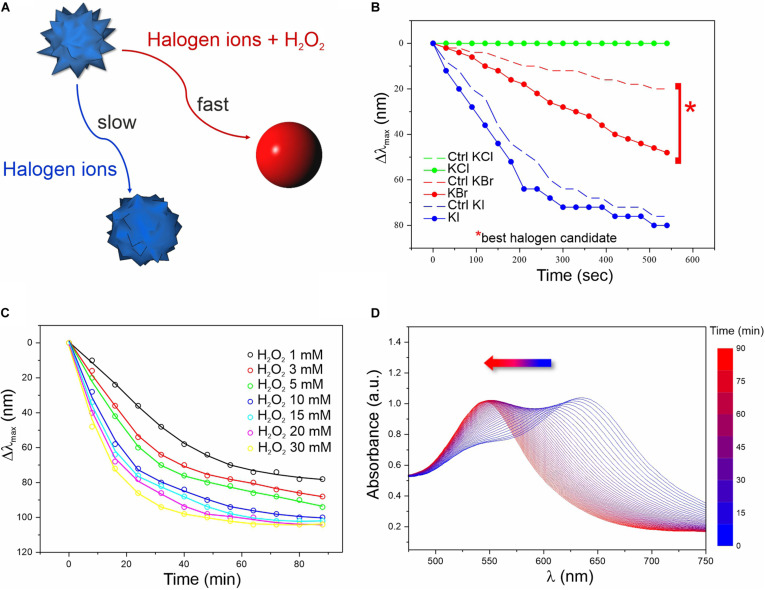
FIGURE 1.
Screening of the chemical conditions for the colorimetric assay. (A) Schematics of the reactions involved in the MGNP morphological changes in water. (B) LSPR λmax evolution over time related to MGNP reaction with H2O2 (3 mM) in presence of optimized concentrations of different halogens (more info in Supplementary Material). Control (Ctrl) performed in absence of H2O2. (C) LSPR λmax evolution of MGNPs exposed to Br– (5 mM) with increasing H2O2 concentration (1–30 mM). (D) Absorption spectra related to the MGNP reshaping process for optimized reaction conditions (see Supplementary Material). All reactions were carried out at pH = 5.

