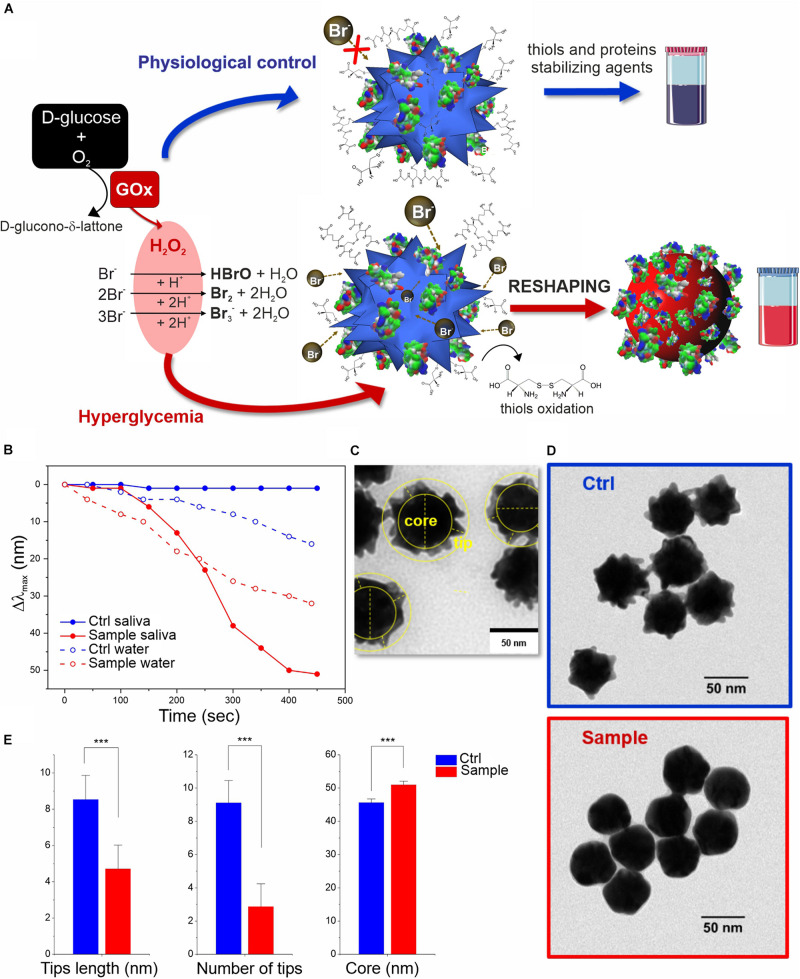
FIGURE 2.
In vitro colorimetric assay using MGNPs suspended in saliva: (A) schematics of the mechanisms involved; (B) LSPR Δλmax evolution over time related to the reshaping in saliva and in water (the two model platforms performance are compared at their own Br– optimized conditions while involving the same particles number, and H2O2 final concentration, 2 mM). TEM micrographs related to the MGNPs before (C) and after (D) the assay with non-supplemented saliva (blue) and with glucose supplement to simulate hyperglycemia condition (red). (E) Statistical TEM analysis measuring tips (numbers and lengths) and “core” dimensional variation between control and sample nanostructures (p < 0.001 in all cases). Statistical significance was determined by Mann-Whitney test (***p < 0.001). See experimental details in Supplementary Material.

