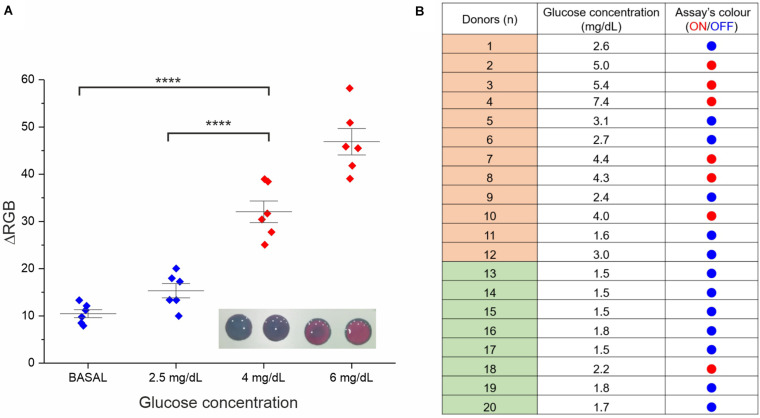
FIGURE 4.
Assay performance analysis in real saliva samples. (A) Validation of the RGB-based readout. Six saliva samples were involved in this study (the average of two experimental replicates is reported). Besides the basal glucose concentration, all samples were normalized through glucose spike at 2.5, 4, and 6 mg/dL, the RGB coordinates values were measured at t = 0 and 15 min with a smartphone app (ColorGrab), and the ΔRGB was calculated. Statistical significance was determined using a one-way ANOVA and Tukey’s multiple comparison test (****P < 0.0001). A representative image of the assay at the four different concentrations is reported in the inset. (B) Assay results for clinical saliva samples from both diabetic subjects (donors 1–12) and healthy subjects (donor 13–20). The “ON” outcome (red dots) refers to ΔRGB ≥ 30 ± 10.

