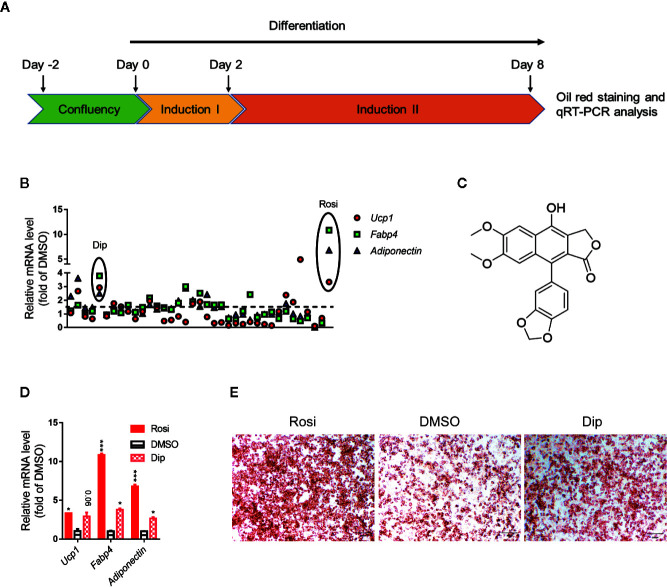
Figure 1.
Differentiation screening of natural products in C3H10-T1/2 cells. (A) Schematic view of the targeting strategy for natural product screening. (B) Relative gene mRNA expression in differentiated cells treated with natural products. (C) Structure of diphyllin (1). (D) Relative gene mRNA expression in differentiated cells treated with rosiglitazone and diphyllin. (E) Oil red O staining in differentiated cells treated with rosiglitazone or diphyllin. For oil red O staining, n=1; for mRNA expression, n=2. *p < 0.05 and ***p < 0.001.

