FIGURE 3.
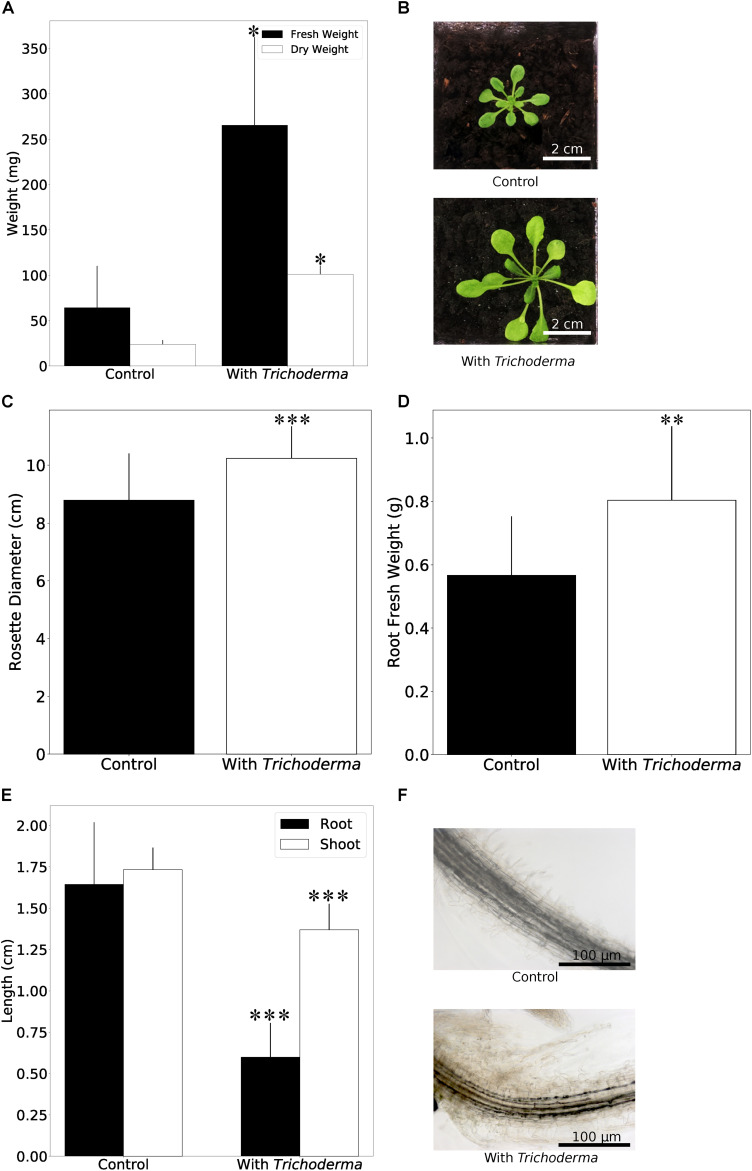
Plant growth performance is influenced by Trichoderma colonization. (A) Fresh and dry weights of A. thaliana grown on soil with or without Trichoderma after 4 weeks. Error bars represent SEs from three independent biological replicates, each with four seedlings. Statistical significance was determined by Welch Two Sample t-test (∗P < 0.05). (B) Growth promotion on A. thaliana on soil after 4 weeks. (C,D) Rosette diameter (C) and root fresh weight (D) of N. attenuata inoculated with or without Trichoderma on soil after 4 weeks. Error bars represent SDs from 39 independent biological replicates for shoots and 18 replicates for roots. Statistical significance was determined by Welch Two Sample t-test (∗∗P < 0.01; ∗∗∗P < 0.001). (E) Shoot and root lengths of N. attenuata 12 days after co-cultivation with Trichoderma (spore solution O.D.600 nm = 0.0135) or without Trichoderma on Petri dishes. Error bars represent SDs from 10 biological replicates. Statistical significance was determined by Welch Two Sample t-test (∗∗∗P < 0.001). (F) Microscopy of N. attenuata roots 12 days on Petri dishes with or without Trichoderma.

