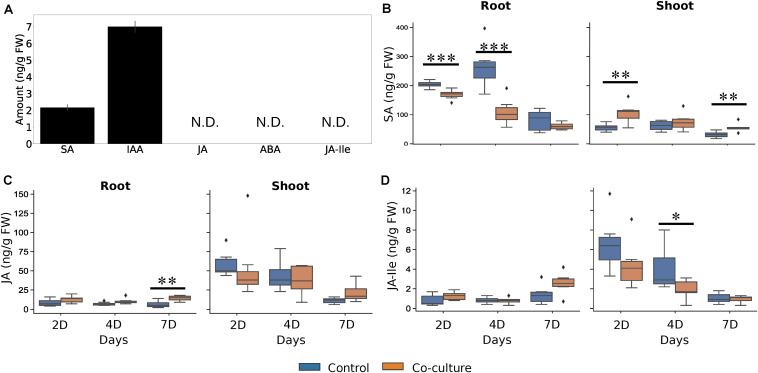
FIGURE 9.
Trichoderma facilitates the allocation of phytohormones in A. thaliana. (A) Phytohormone levels in Trichoderma mycelium. Error bars represent the SEs from six independent biological replicates. N.D., not detected. (B–D) SA (B), JA (C), and JA-Ile (D) levels from control and co-cultured seedlings in roots and shoots 2, 4, and 7 days after co-cultivation. Statistical significance was determined by Welch Two Sample t-test between control and co-culture treatments (∗P < 0.05; ∗∗P < 0.01; ∗∗∗P < 0.001). At least 6 biological replicates were used for measurement, each with 16 seedlings. ABA, abscisic acid; IAA, indole-3-acetic acid; SA, salicylic acid; JA, jasmonic acid; JA-Ile, jasmonoyl-isoleucine conjugate. The diamond shape in the figure represent outliers, which the data points exceed 1.5 times of the inter-quartile range from the 75th percentiles, or lower than 1.5 times of the inter-quartile range from the 25th percentiles. The inter-quartile range is the range between 25th and 75th percentiles.

