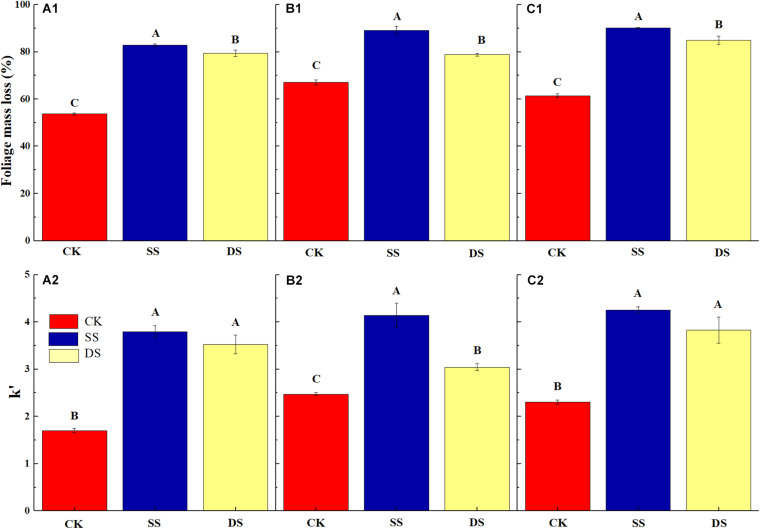
FIGURE 1.
The mass loss (%) of bald cypress (A1), Chinese willow (B1), and the mixtures (C1) at the end of the one-year experiment; and the decomposition rate (k′, k × 103) of bald cypress (A2), Chinese willow (B2), and the mixtures (C2) during the decomposition period. Different uppercase letters indicate significant (P < 0.05) differences of mass loss as well as decomposition rate for each foliage type; CK, SS, and DS represent no submergence, shallow submergence, and deep submergence, respectively.

