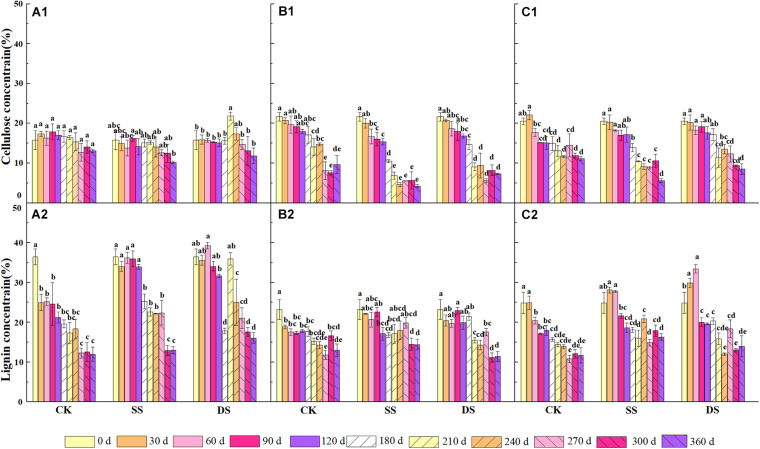
FIGURE 3.
The concentrations of cellulose and lignin of bald cypress (A1,A2), Chinese willow (B1,B2), and the mixtures (C1,C2) during each decomposition period across one-year. Different lowercase letters indicate significant (P < 0.05) differences of cellulose and lignin concentration among different submergence depths at each sampling time for each foliage type. CK, SS, and DS represent no submergence, shallow submergence, and deep submergence, respectively.

