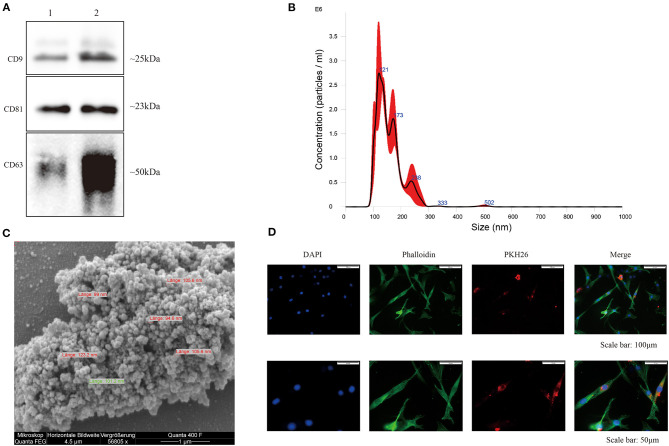
Figure 2.
Characterization of hBMSC-derived EVs. (A) Representative western blot image (n = 4) demonstrates standard surface markers (CD9, CD63, and CD81) of hBMSC-derived EVs (lane 1: hBMSC lysate; lane 2: hBMSC-EVs). (B) Particle size distribution of hBMSC-EVs was measured by NTA. (C) Morphology of hBMSC-EVs was monitored by SEM, scale bar: 1 μm. (D) Cell nuclei were stained with DAPI (blue) and chondrocytes were stained with phalloidin (green) to visualize the cytoskeleton. PKH26-labeled hBMSC-derived EVs (red) internalized by chondrocytes were visualized with fluorescent microscopy.

