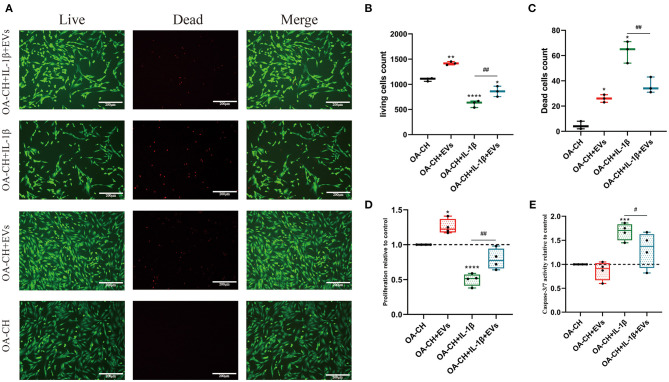
Figure 5.
Effect of hBMSC-EVs on vitality, proliferation, and apoptosis of OA-CH and IL-1β-induced OA-CH. (A–C) Live and dead cells were visualized by fluorescence microscopy after labeling cells with calcein and ethidium homodimer. Living cells were labeled with calcein (green fluorescence) and dead cells were stained with ethidium homodimer (red fluorescence). Scale bar = 200 μm. (D,E) BrdU incorporation assay and Caspase-3/7 activity assay were used to determine the proliferation and apoptosis rate of OA-CH after treatment with hBMSC-EVs or IL-1β for 24 h. The OA-CH group without treatment is used as control and set to 1.0 (black bars). *Significant difference to control (OA-CH): *p < 0.05; **p < 0.01; ***p < 0.001; ****p < 0.001; #significant difference between groups: #p < 0.05; ##p < 0.01; one-way ANOVA with Newman–Keuls Multiple Comparison Test; n = 4.

