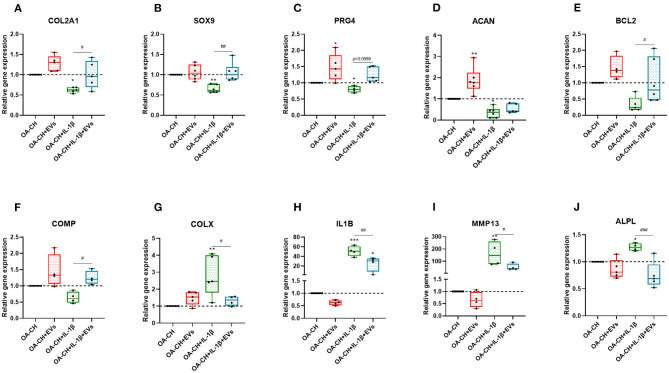
Figure 6.
hBMSC-EV effect on gene expression of anabolic and catabolic genes. (A–F) After 24 h treatment with IL-1β and/or hBMSC-EVs, gene expression levels of COL2A1, SOX9, PRG4, ACAN, BCL2, and COMP (anabolic) and COLX, IL1B, MMP13, and ALPL (catabolic) were determined using real-time PCR analysis (G–J). All values represent mean ± standard deviation. *Significant difference to control (OA-CH): *p < 0.05; **p < 0.01; ***p < 0.001; #significant difference between groups: #p < 0.05; ##p < 0.01; ###p < 0.001. One-way ANOVA with Newman–Keuls Multiple Comparison Test (n = 4–6); EVs: hBMSC-EVs.

