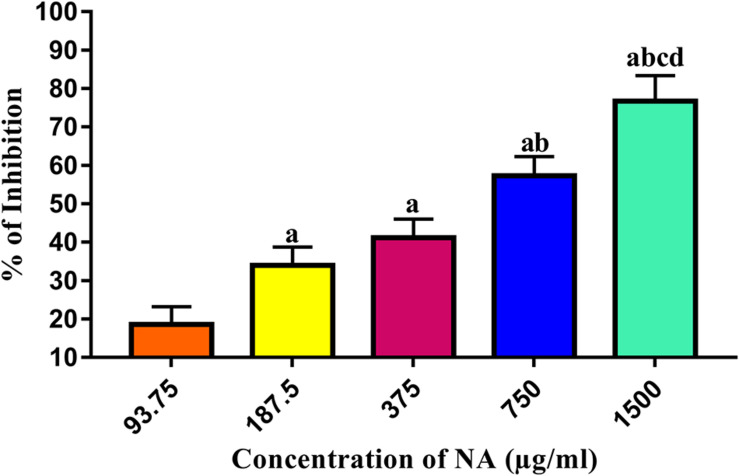
FIGURE 1.
Determination of MBIC of NA against A. hydrophila biofilm formation. Results indicate the mean values of three independent experiments and SD. The Tukey’s multiple comparisons test (one-way analysis of variance) was used to compare the groups. ap ≤ 0.0001 when compare to control, bp ≤ 0.0001 when compare to 93.75 μg/ml, cp ≤ 0.0001 when compare to 187.5 μg/ml, and dp ≤ 0.0001 when compare to 375 μg/ml.

