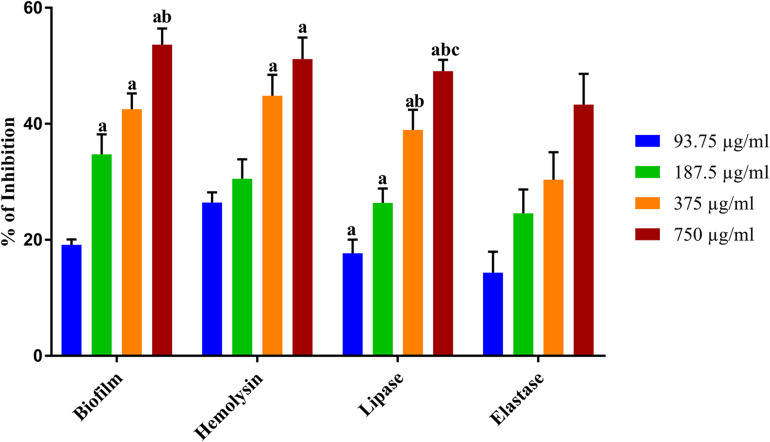
FIGURE 2.
Inhibitory effect of NA on the QS controlled virulence factors production. The graph illustrates percentages of biofilm, hemolysin, lipase, and elastase inhibition in A. hydrophila upon treatment with NA at different concentrations (93.75–750 μg/ml). Results indicate the mean values of three independent experiments and SD. The Tukey’s multiple comparisons test (one-way analysis of variance) was used to compare the groups. ap ≤ 0.0001 when compare to control, bp ≤ 0.0001 when compare to 93.75 μg/ml, and cp ≤ 0.0001 when compared to 187.5 μg/ml.

