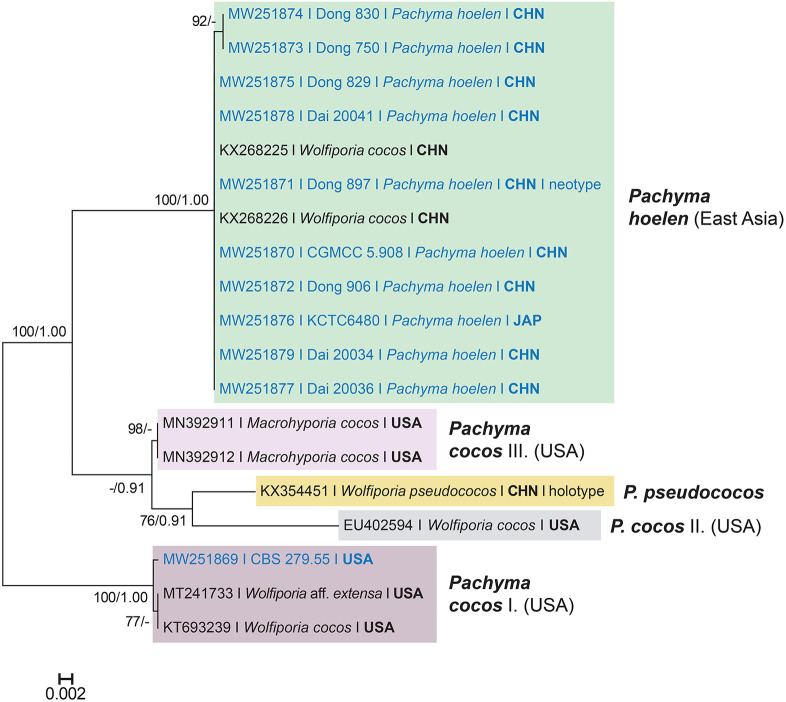
Figure 2.
Phylogeny of Pachyma hoelen and related taxa inferred from RAxML and MrBayes analyses of nrDNA ITS sequences. Topology is from the best scoring Maximum Likelihood (ML) tree. Bayesian Posterior Probabilities (BPP) > 0.9 and ML bootstrap values > 70% are shown above or below branches. The bar indicates 0.002 expected change per site per branch.

