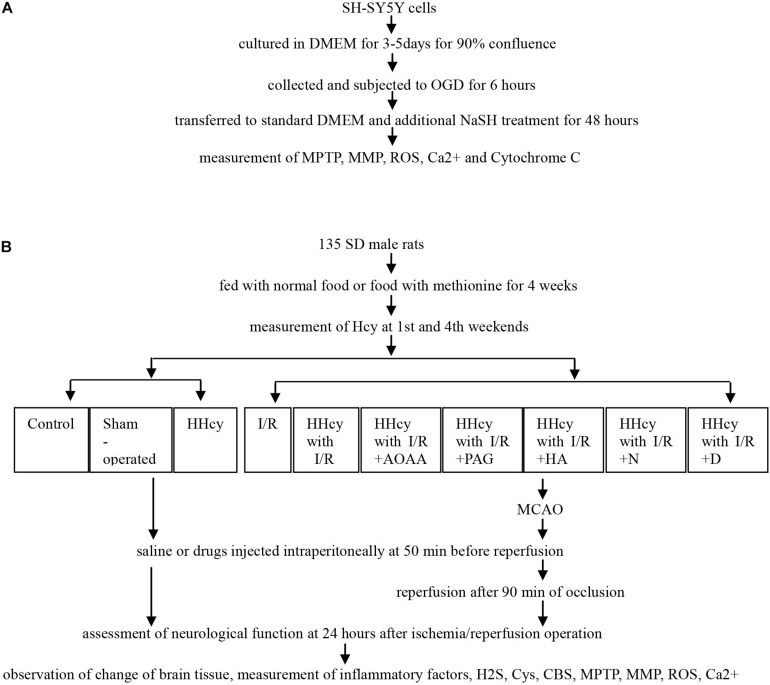
FIGURE 1.
Flowchart of experimental process. (A) SY5Y cells were cultured and subjected to OGD and different NaSH treatment, and then collected to measurement of MPTP, MMP, ROS, Ca2+ and Cytochorme C. (B) SD males fed using normal food or food with methionine were divided into ten groups, and received MCAO or not, saline or inhibitor injected intraperitoneally, and finally assessed for neurological function, morphological change and cytokines levels. *HHcy, hyperhomocysteinemia; I/R, ischemia/reperfusion; AOAA, aminooxyacetic acid; PAG, DL-propargylglycine; HA, hydroxylamine; N, N-anandamide; D, Pyrrolidine dithiocarboxylic acid ammonium salt.

