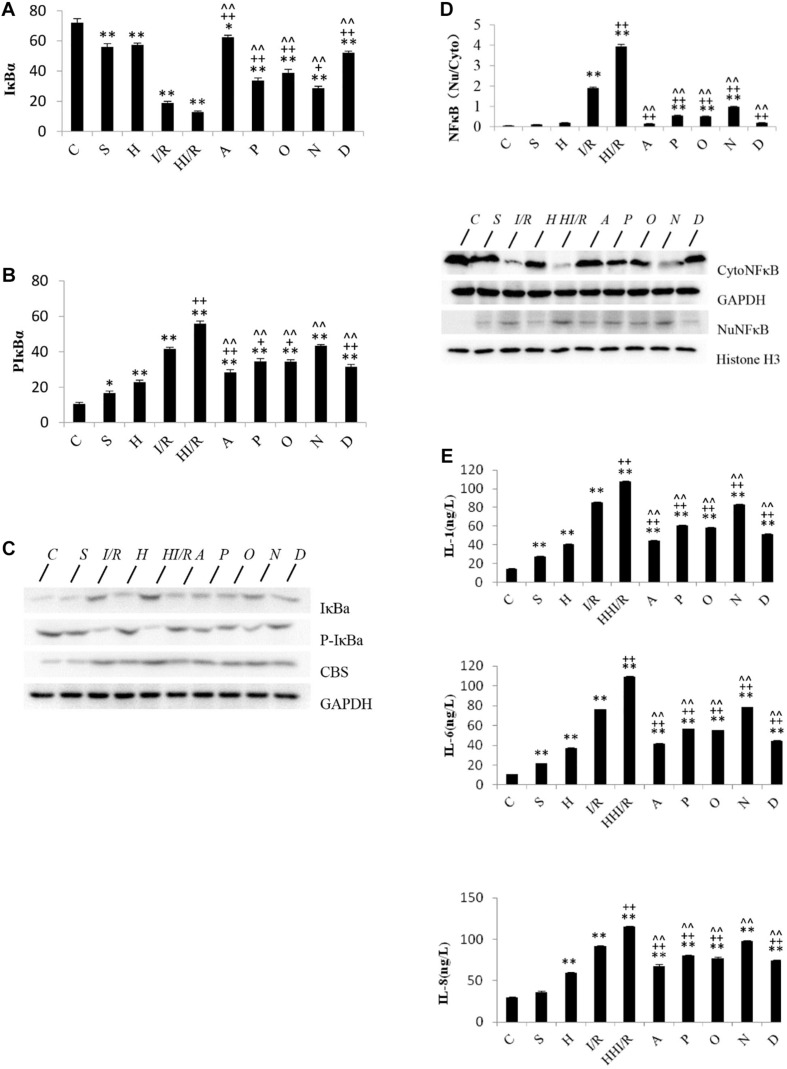
FIGURE 5.
Changes of IκBα, p-IκBα, and NFκB translocation, IL-1, IL-6, and IL-8 levels in cerebrum tissue in rats 24 h after I/R or not. (A) IκBα levels decreased significantly in all other groups, compared to the C group (P < 0.05 or 0.01). The first and second lowest IκBα levels appeared in the HI/R and I/R groups, respectively (P < 0.01), and increased by all inhibitors (n = 3, P < 0.05 or 0.01). (B) The first and second lowest P-IκBα levels appeared in the HI/R and I/R groups, respectively (P < 0.01). Significant decrease of p-IκBα levels appeared in all inhibitor groups than in the HI/R group, but appeared in A, P, O, and D groups when compared to the I/R group (n = 3, P < 0.05 or 0.01). (C) The blot band demonstrated changes of IκBα, p-IκBα, and CBS protein levels in each group. GAPDH was used as normalized protein. (D) Translocation of NFκB levels into nuclear evidently increased in I/R and HI/R groups compared to control group, and decreased by all inhibitors (n = 3, P < 0.01). The blot band showed changes of Cyto NFκB and Nu NFκB protein levels in each group. GAPDH and Histone H3 were used as normalized protein, separately. (E) The IL-1, IL-6, and IL-8 levels in I/R and HI/R groups significantly increased compared to control groups, especially in the latter, and evidently decreased in A, P, O, and D groups than that in HI/R group and I/R group (n = 3, P < 0.01). ∗∗ or ∗ means P < 0.01 or 0.05 versus control, ++or + means P < 0.01 or 0.05 versus I/R group, and ∧∧ or ∧ means P < 0.01 or 0.05 versus HI/R group, analyzed by one-way ANOVA and Bonferroni post hoc test.

