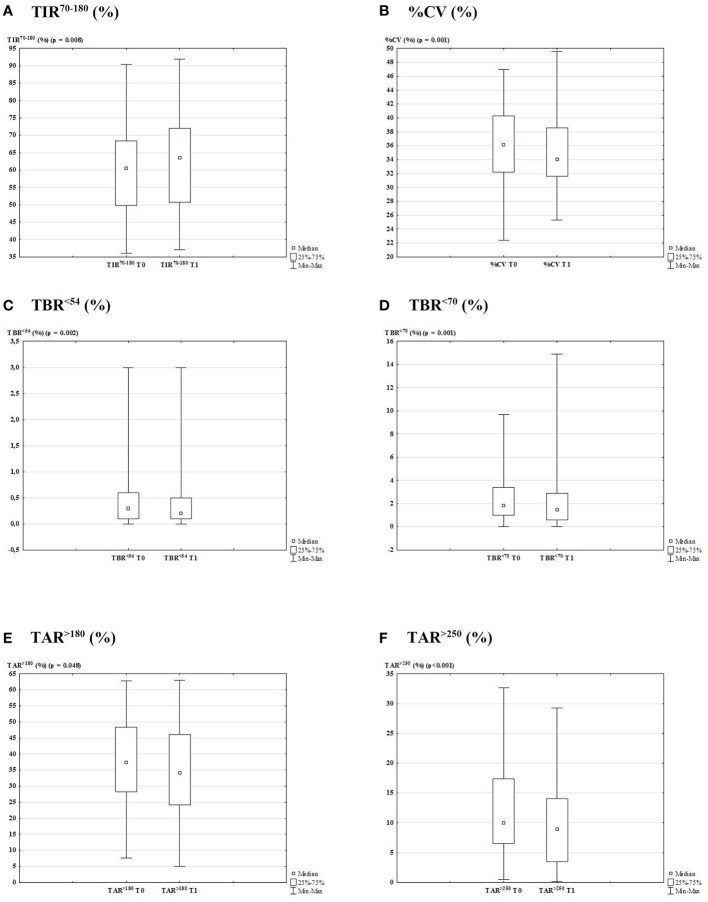
Figure 2.
Glycemic control data generated from the AGP report 3-months before and after lockdown due to COVID-19 outbreak (T0 vs. T1). Box plot with the percentage of TIR70-180 (A; p = 0.008), CV (B; p = 0.001), TBR<54 (C; p = 0.002), TBR<70 (D; p = 0.001), TAR>180 (E; p = 0.048), and TAR>250 (F; p < 0.001).

